


MES Software: Vendors, Features & Costs Compared 2026
MES software compared: vendors, functions per VDI 5600, costs (cloud vs. on-premise) and implementation. Honest market overview 2026.
Real-time data monitoring in manufacturing is the continuous, automatic collection and visualization of production data as it happens on the shop floor. Instead of waiting for shift-end reports, daily summaries, or weekly reviews, real-time monitoring provides instant visibility into machine states, production counts, process parameters, alarms, and KPIs while production is running.
In practice, this means: when a machine stops, the dashboard shows it within seconds. When a cycle time deviates from the target, the system detects it immediately. When an alarm fires on a PLC, it appears on the alarm monitor in real time. When OEE drops below a threshold, a notification is sent to the production manager's phone. The data flows continuously from the machine to the screen, with no manual entry, no time delay, and no information gap.
Real-time data monitoring is the foundation of every modern MES (Manufacturing Execution System). Without real-time data, an MES is a reporting tool that shows what happened yesterday. With real-time data, an MES becomes an operational tool that shows what is happening now and enables immediate action.
| Data type | What is captured | Source | Update frequency | Manufacturing use |
|---|---|---|---|---|
| Machine state | Running, stopped, idle, alarm, setup, maintenance. The current operational state of each machine. | Digital signals from PLC or IoT gateway. Signal change triggers state change in MES. | Event-driven (milliseconds). State changes are captured the instant they occur. | Availability monitoring. Downtime detection. Alarm escalation. Shopfloor visualization (green/red/yellow machine status). |
| Production count | Number of parts produced (good parts, scrap, rework). Count per cycle, per hour, per shift, per order. | Cycle completion signal from machine. Ejection signal. Counter from PLC. | Per cycle (seconds to minutes depending on process). | Performance monitoring. Output tracking. Order progress. Target vs. actual comparison. |
| Cycle time | Time per production cycle. Actual vs. planned cycle time. Micro-stop detection (short interruptions below downtime threshold). | Calculated from cycle completion signals. Time between two consecutive good-part signals. | Per cycle. | Performance factor of OEE. Speed loss identification. Bottleneck detection. |
| Machine alarms | PLC alarm messages with alarm code, description, timestamp, duration. Active alarms and alarm history. | PLC alarm registers via OPC UA. Digital alarm signals via IoT gateway. | Event-driven (immediate on alarm trigger). | Root cause analysis. Alarm Pareto (top 10 alarms by frequency and duration). Correlation between alarms and quality defects. |
| Process parameters | Temperature, pressure, torque, speed, current, flow rate, humidity. Any measurable process variable. | Analog or digital values from PLC via OPC UA. Sensor data via IoT gateway. | Configurable: every second, every cycle, or on change. Depends on process criticality. | SPC monitoring. Process drift detection. Correlation of process parameters with quality outcomes. Traceability (process data per part). |
| Energy consumption | Power consumption per machine, per line, per plant. kWh per part or per order. | Energy meters connected via IoT gateway or OPC UA. | Every 1 to 15 seconds depending on meter resolution. | Energy monitoring. Peak load detection. Cost allocation per product. Sustainability reporting. |
Real-time data monitoring requires a continuous data path from the machine on the shop floor to the dashboard on the screen. In a cloud-native architecture, this path has four layers:
| Layer | What happens | Technology | Latency |
|---|---|---|---|
| 1. Machine / PLC | The machine generates data: signals change state (running/stopped), counters increment (part produced), alarms fire, process values are measured. | PLC (Siemens, Beckhoff, Allen-Bradley, etc.), sensors, actuators. The machine is the data source. | Milliseconds (PLC scan cycle). |
| 2. Gateway / Edge | An IoT gateway reads data from the PLC or from digital/analog signals and transmits it to the cloud. No PLC program change required. Gateway buffers data if network connection is temporarily lost. | OPC UA for modern PLCs. Digital I/O gateway for legacy machines (no digital interface). MQTT protocol for data transport. Edge computing for local pre-processing. | Seconds (gateway polling interval + network transmission). |
| 3. Cloud platform | Data arrives in the cloud, is validated, transformed, stored, and made available for real-time processing. KPIs are calculated (OEE, availability, performance, quality). Alarm correlation is performed. Notifications are triggered. | Cloud infrastructure (e.g., Microsoft Azure). Microservice architecture. Real-time data processing pipelines. Time-series databases. | Seconds (data ingestion + processing). |
| 4. Dashboard / Client | Users see the data on real-time dashboards, shopfloor monitors, mobile apps, or receive notifications via email/push. Data refreshes automatically. | Web-based dashboards. Shopfloor TV displays. Smartphone MES app. Email and push notifications. | Seconds (dashboard refresh interval). |
Total end-to-end latency from machine event to dashboard display is typically 5 to 30 seconds in a cloud-based architecture. This is fast enough for operational decision-making in manufacturing. When a machine stops, the production manager sees it on the dashboard within seconds and can initiate corrective action immediately.
| Dimension | Manual / delayed reporting | Real-time data monitoring |
|---|---|---|
| Data collection | Operators fill out paper forms or enter data into Excel at end of shift. Data is aggregated manually. | Data is captured automatically from machine signals. No manual entry required for machine states, counts, cycle times, or alarms. |
| Time delay | Hours to days. Shift report is available the next morning. Weekly report is available on Monday. Monthly KPI review happens weeks after the events. | Seconds. Machine state changes, production counts, and alarms are visible on the dashboard within seconds of occurring. |
| Data accuracy | Subjective. Downtime durations are estimated. Short stops are not recorded. Operators round numbers or omit events they consider insignificant. | Objective. Every machine state change is recorded with exact timestamp and duration. Short stops (micro-stops) that operators do not report are captured automatically. |
| Reaction time | Reactive. Problems are discussed in the next shift meeting or daily production meeting. By then, the problem may have existed for hours or days. | Immediate. Problems trigger notifications within seconds. Production managers can intervene during the current shift, not the next one. |
| Data completeness | Incomplete. Only events that operators choose to record are captured. The "hidden factory" (unrecorded losses) remains invisible. | Complete. Every second of production time is accounted for. Every state change is logged. The true picture of production performance is visible, including losses that were previously hidden. |
| Cost of data collection | High ongoing cost. Operators spend 15 to 30 minutes per shift on data entry instead of operating machines. Data must be manually compiled into reports. | Low ongoing cost. Automatic data collection runs continuously without operator effort. Reports and dashboards update automatically. |
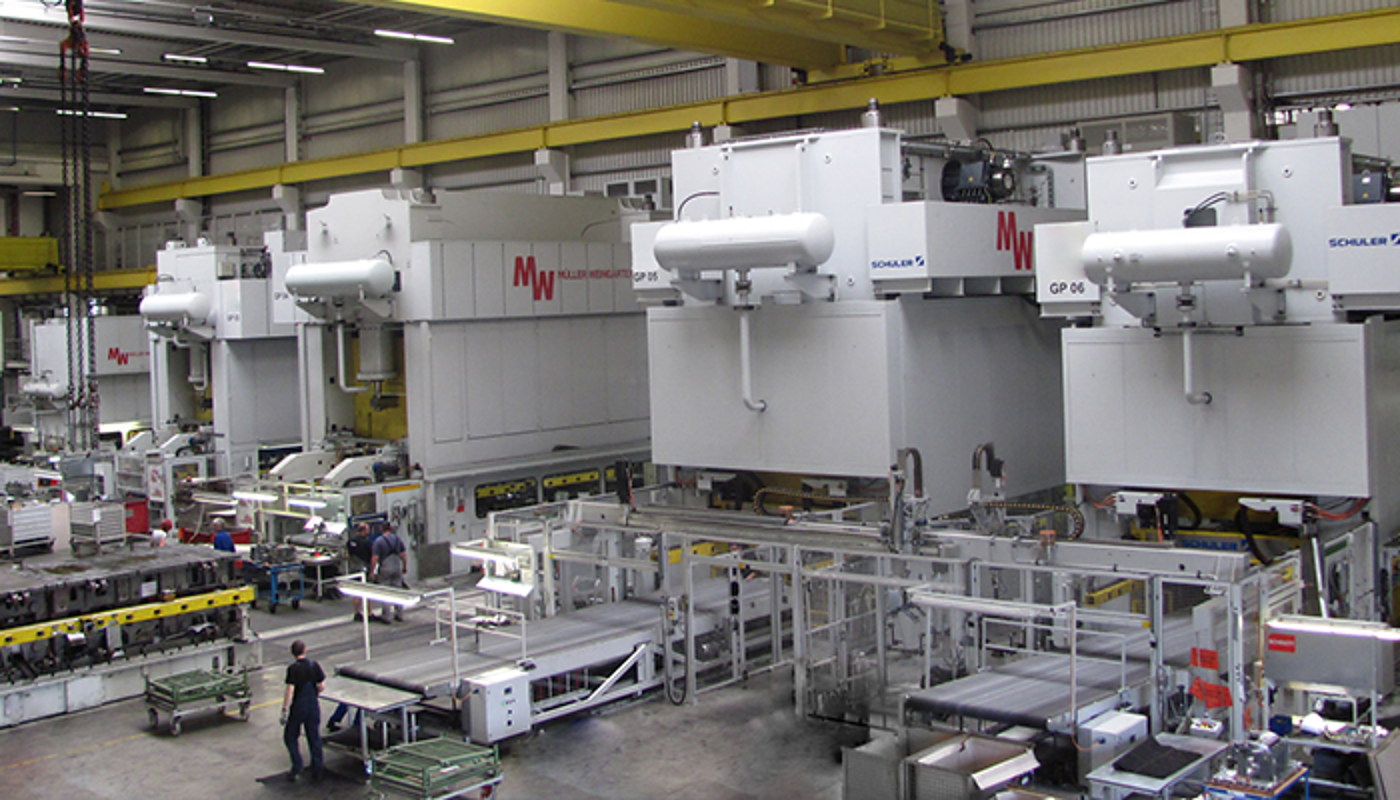
The biggest practical challenge in real-time data monitoring is connecting the machines. Most manufacturing companies have a mixed machine park: modern machines with Ethernet and OPC UA alongside older machines from the 1990s or 2000s with no digital interface at all.
| Machine type | Connectivity method | Data available | Installation time per machine |
|---|---|---|---|
| Modern PLC with OPC UA | OPC UA server on PLC. Gateway reads data via OPC UA protocol over Ethernet. No PLC program change required. | Full data: machine states, production counts, cycle times, alarms, process parameters. All data exposed by the OPC UA server. | 2 to 4 hours. |
| PLC with Ethernet but no OPC UA | Gateway communicates via proprietary protocol (e.g., S7 protocol for Siemens). Reads data directly from PLC registers. | Machine states, counts, alarms, and process parameters available in the PLC memory. Selection depends on PLC configuration. | 4 to 8 hours. |
| Legacy machine without digital interface | Digital I/O gateway. Electrical signals (24V) are tapped from existing machine signals: running signal, cycle complete signal, alarm signal. No PLC modification needed. | Basic but sufficient: running/stopped state, cycle count, alarm state. Enough for OEE calculation and downtime analysis. | 2 to 4 hours. |
| Machine with EUROMAP interface (injection molding) | Standardized EUROMAP 63/77/83 interface. Gateway reads standardized data set. | Standardized machine data: machine state, shot counter, cycle time, mold data, process parameters. | 2 to 4 hours. |
SYMESTIC connects machines across all four categories. The platform supports OPC UA for modern PLCs (Siemens, Beckhoff, Allen-Bradley), digital I/O gateways for legacy machines without any digital interface, and MQTT for IoT device integration. At Carcoustics, 500+ machines across 7 countries were connected via IXON IoT devices and MQTT protocol. At Klocke, all packaging lines were connected via digital I/O gateways with no LAN infrastructure required (LTE connectivity). At Brita, modern lines were connected via OPC UA to line controllers for alarm capture, while older lines used digital signal tapping. The installation time per machine is typically 2 to 4 hours, with no production interruption and no PLC program modification.
| Use case | What is monitored | What action it enables | Measurable impact |
|---|---|---|---|
| Downtime monitoring | Every machine stop is detected automatically. Duration, frequency, and reason (if PLC alarm is available) are recorded. | Immediate notification to maintenance. Downtime Pareto shows top causes. Recurring stops trigger systematic corrective actions. | Neoperl: 10% fewer downtimes. Meleghy: 10% reduction in downtime. Brita: 5% reduction. |
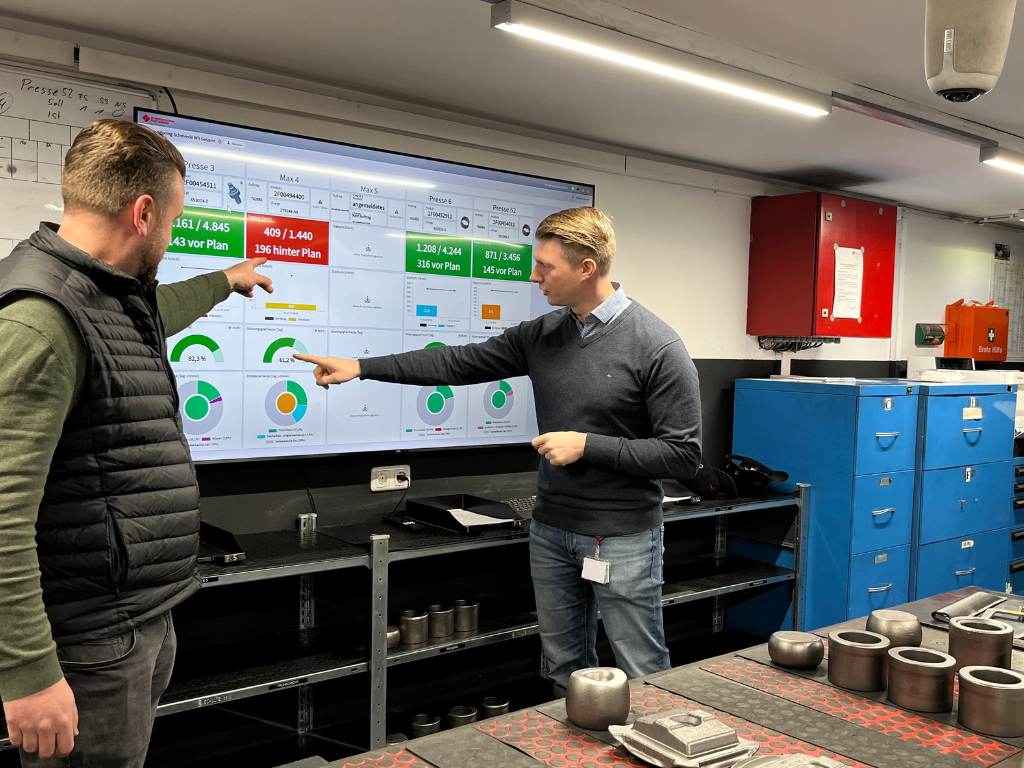
| OEE monitoring | OEE (Availability x Performance x Quality) calculated in real time per machine, line, plant. Updated with every cycle. | Live target vs. actual comparison. If OEE drops below target during a shift, corrective action can happen immediately, not at the next shift meeting. | Klocke: 12% improvement in output, 8% improvement in availability. Carcoustics: 8% improvement in availability. |
| Alarm monitoring and correlation | PLC alarms captured from machine controllers. Alarm frequency, duration, and patterns analyzed. Correlation with quality defects and downtimes. | Alarm Pareto identifies the most impactful alarms. Alarm-quality correlation reveals which machine alarms cause which quality problems. | Neoperl: 15% less scrap through alarm-quality correlation. 15% productivity gain through targeted actions. |
| Plant-wide visibility | All machines across all plants displayed on a single dashboard. Status overview: how many machines running, stopped, in setup, in alarm. | Plant managers and COOs see the production status of all locations from one screen. Capacity bottlenecks and underperforming plants become visible immediately. | Meleghy: 6 plants in 4 countries on one platform within 6 months. Carcoustics: 500+ machines across 7 countries. |
| Order progress tracking | Real-time count of parts produced per order. Percentage completion. Estimated time to completion based on current production rate. | Production planners see whether orders will finish on time. If an order falls behind, they can reallocate resources or adjust the schedule during the shift. | Schmiedetechnik Plettenberg: real-time order status feedback to InforCOM ERP. Elimination of manual production reporting. |
What does "real time" mean in manufacturing?
In manufacturing, "real time" means data is available within seconds of the event occurring on the machine. When a machine stops, the dashboard shows it within 5 to 30 seconds. This is not the same as "instant" (zero latency), but it is fast enough to enable immediate operational decisions. The alternative (shift-end reports or daily summaries) means delays of hours to days, during which problems continue undetected.
Can old machines be monitored in real time?
Yes. Machines without a digital interface (no PLC network, no Ethernet, no OPC UA) can be connected using digital I/O gateways. These gateways tap into existing electrical signals (24V running signal, cycle complete signal, alarm signal) without modifying the PLC program and without interrupting production. This provides basic but sufficient data for OEE calculation and downtime monitoring. At Klocke, all packaging lines were connected via digital I/O gateways, with each gateway operating on LTE (no factory network required).
How does real-time monitoring improve OEE?
Real-time monitoring improves OEE by making losses visible while they are happening, not after. Availability improves because downtimes are detected immediately and maintenance response time decreases. Performance improves because micro-stops and speed losses that were previously invisible (because operators did not report them) are now captured automatically. Quality improves because scrap and rework are tracked per machine and per product in real time, enabling immediate corrective action when defect rates spike.
What is the difference between real-time monitoring and SCADA?
SCADA (Supervisory Control and Data Acquisition) is a real-time monitoring and control system focused on the process level: it reads sensor data and controls actuators in real time. An MES with real-time monitoring operates at the production management level: it collects machine data and calculates production KPIs (OEE, downtime Pareto, order progress). SCADA controls the process. MES monitors the production. In many factories, SCADA handles the machine-level control while MES provides the plant-level production visibility.
Does real-time monitoring require a factory network?
Not necessarily. Cloud-based solutions can use LTE/cellular connectivity from the IoT gateway directly to the cloud, bypassing the factory network entirely. This is particularly useful for legacy plants with no Ethernet infrastructure, for machines in remote locations, or for companies where IT security policies restrict access to the factory LAN. SYMESTIC supports both LAN/WiFi and LTE connectivity options per gateway.

