


Contents
Fault tree analysis (FTA) is a top-down method that starts from one undesired event, the top event, and works backward to the combinations of faults that can cause it. The result is a fault tree: a diagram that links the top event through logic gates to basic events, such as a broken tool or a skipped check. The NASA Fault Tree Handbook stresses that a fault tree models the ways one specific event can occur, not every possible failure of a system (NASA, 2002).
The method comes from reliability and safety engineering. The US Nuclear Regulatory Commission published its Fault Tree Handbook in 1981 (NUREG-0492), and the international standard is IEC 61025. In manufacturing, the top event is often a defect that reaches the customer or an unplanned stop of a line.
Events and gates
| Element | Meaning |
|---|---|
| Top event | the undesired event the tree analyzes |
| Intermediate event | an event caused by the events below it |
| Basic event | an initiating fault that is not developed further |
| Undeveloped event | not developed further, because it matters little or information is missing |
| OR gate | the output occurs if at least one input occurs |
| AND gate | the output occurs only if all inputs occur |
| Other gates | priority AND, exclusive OR, inhibit, k out of n; NASA notes that all are special cases of AND and OR |
For independent events with probabilities P(A) and P(B), an OR gate gives P = P(A) + P(B) − P(A) · P(B) and an AND gate gives P = P(A) · P(B). For small probabilities below 0.1 the plain sum is close enough for an OR gate. If events are not independent, an AND gate can be far more likely than the product suggests.
Steps of a fault tree analysis
- Define the top event precisely, for example “housing without thread is shipped” rather than “quality problem”.
- Set the boundaries and assumptions: which machines, which inspection steps, which period.
- Build the tree downward. For each event, ask which immediate causes lead to it and whether they act alone (OR) or only together (AND).
- Stop at basic events for which data or sound estimates exist.
- Determine the minimal cut sets.
- Quantify the tree where data exist.
- Act on the most important cut sets and update the tree after every change.
Minimal cut sets
A cut set is a combination of basic events that causes the top event. A minimal cut set is one that can no longer be reduced. A minimal cut set with a single basic event is a single point of failure: one fault alone causes the top event. These come first in any improvement. The top event probability can be approximated as the sum of the probabilities of the minimal cut sets. NASA considers this accurate enough as long as the basic event probabilities stay below 0.1; the example below has one that does not and is calculated exactly.
Example: a housing without thread reaches the customer
The numbers are invented for illustration. A housing gets an M8 thread in operation 30, and final inspection checks every tenth housing with a thread gauge. The top event requires two things: the thread is missing (A) and inspection does not catch it (B).
| Event | Gate or cause | Probability per housing |
|---|---|---|
| A thread missing | OR of A1, A2, A3 | 1.7 × 10⁻⁴ |
| A1 | tap broken, not noticed | 1.0 × 10⁻⁴ |
| A2 | operation skipped after a program restart | 5 × 10⁻⁵ |
| A3 | wrong program version loaded | 2 × 10⁻⁵ |
| B inspection misses it | OR of B1, B2 | 0.905 |
| B1 | housing not in the sample | 0.9 |
| B2 | gauge check skipped or misread | 0.05 |
B is not a rare event, so it needs the exact OR formula: 1 − 0.1 × 0.95 = 0.905. The top event follows from the AND gate: 1.7 × 10⁻⁴ × 0.905 = 1.5 × 10⁻⁴. That is about 8 housings in 50,000. There are six minimal cut sets, each with one A and one B event, so there is no single point of failure. The largest is A1 with B1 at 9 × 10⁻⁵.
| Measure | Top event per housing | Escapes per 50,000 housings |
|---|---|---|
| Current state | 1.5 × 10⁻⁴ | about 8 |
| Gauge check on every housing at final inspection | 8.5 × 10⁻⁶ | about 0.4 |
| Probe check in the machine (fails 1 in 1,000), sampling unchanged | 1.5 × 10⁻⁷ | about 0.008 |
| Probe check, but its cycle sits in the same program as the thread | 1.8 × 10⁻⁵ | about 0.9 |
The last row shows why independence has to be checked. If the probe cycle is part of the same NC program, a wrong program version (A3) removes the thread and the check at once. The calculation assumes that a restart (A2) still runs the probe cycle; if a restart skips both, A2 bypasses the check as well. A3 then needs only B to cause the top event, and the result is more than a hundred times worse than the independent calculation. The NASA handbook makes the same point for redundant components with a common cause.
FTA and FMEA compared
| Aspect | FTA | FMEA |
|---|---|---|
| Direction | top-down, from one event to its causes | bottom-up, from each failure mode to its effects |
| Starting point | one defined undesired event | every item or process step |
| Combinations | modeled with AND gates | single failure modes, no combinations |
| Result | minimal cut sets, probability of the top event | failure modes with ratings and actions |
| Best when | the critical event is known and its causes are sought | a design or process is reviewed systematically |
According to NASA, FMEAs cannot be combined into a fault tree, but an FMEA helps to check a tree for missing causes. More on the FMEA page. 5 Why and the Ishikawa diagram look for the cause of an event that has already happened, see root cause analysis.
Using production data in a fault tree
In a factory, the probabilities of basic events come from its own records: tool breakage per thousand parts, program restarts per shift, defects found at inspection. When the top event is a line stop, mean time between failures gives the failure frequency of each machine (MTBF), and the MTBF and MTTR calculator turns downtime records into both values.
What SYMESTIC contributes
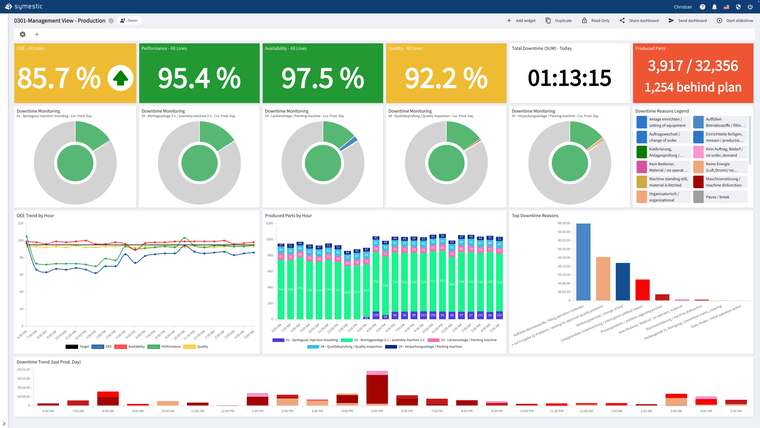
SYMESTIC does not draw fault trees. It supplies data for the basic events. Downtime is detected automatically and recorded with its reason, and MTBF and MTTR are calculated per machine. Quality inspections are recorded at the workstation per part with serial number as OK or NOK, using a defect catalog. Alerts go out by push or e-mail when defined conditions occur. SYMESTIC is not a maintenance management system (CMMS); data can be passed to one via the REST API.
More on the pages on downtime tracking and quality control.
Sources
- NASA: Fault Tree Handbook with Aerospace Applications, version 1.1, August 2002
- US Nuclear Regulatory Commission: Fault Tree Handbook, NUREG-0492, January 1981
- IEC: IEC 61025:2006 Fault tree analysis (FTA)

A free live demo based on your own use case shows how downtime reasons, MTBF, MTTR and inspection results are recorded per machine and part.
See SYMESTIC on your own use case
In a free live demo, a product expert walks you through the running platform and shows what OEE, downtime and the connection of your machines and ERP look like in practice.
- Live OEE
- Downtime and reasons
- Connecting machines and ERP