



Contents
A shopfloor board makes current production conditions and required actions visible to the people responsible for an area. It combines a defined reporting scope with a routine for responding to deviations, on paper or on a screen. Many boards group their metrics as SQDC (safety, quality, delivery, cost), often with a fifth row for morale or people. This page works through the delivery line: plan versus actual by hour.
In daily management, as Jeffrey Liker describes it in Three Faces of Lean Management (2025), team members huddle around visual boards whose KPIs are marked green, yellow or red, and tiered meetings at all levels keep goals aligned. The board is the working surface of that routine; its value shows in the decisions taken in front of it.
Two Board Formats From the Lean Enterprise Institute
| Form | Structure | Typical Use |
|---|---|---|
| Production Analysis Board | Header with line or cell, team leader, quantity required, takt time, shift and number of operators; columns for time, hourly plan and actual, cumulative plan and actual, problems and causes, sign-off | Hour-by-hour tracking at the exit of a cell |
| Team Board | Rows S, Q, D, C and M (morale); columns for concerns, countermeasures, tracking by day and night shift, and results; fields for team action plan, problem solving and kaizen | Daily and improvement work of one team |
Both forms are free downloads from the Lean Enterprise Institute: the Production Analysis Board and the Team Board form. The first answers "are we on plan this hour"; the second collects the concerns and countermeasures of the whole team in the SQDC order.
Give Each Number a Decision
A board should tell the team what needs attention now. The production area, the time period and the quantity definition must be visible. A green percentage with an unknown denominator gives the meeting little basis for deciding what to do.
| Board Field | Example Content | Decision It Supports |
|---|---|---|
| Plan and actual | Accepted units for the current hour | Determine whether the shift is falling behind |
| Deviation | Quantity and relevant lost minutes | Select the issue to investigate |
| Action | Specific next check with an owner | Avoid an unassigned problem list |
| Follow-up | Due point and evidence of effect | Check whether the action worked |
Safety and quality concerns follow their own escalation rules, whatever their position on the board. On the LEI team board, safety and quality are the first two rows, above delivery.
Read Hourly and Cumulative Performance Separately
In the table below, a cell plans 100 accepted units in each of three hours and produces 100, then 80, then 110. Its columns follow the Production Analysis Board.
| Hour | Plan | Actual | Deviation | Cumulative Plan | Cumulative Actual | Problem and Owner |
|---|---|---|---|---|---|---|
| 1 | 100 | 100 | 0 | 100 | 100 | None |
| 2 | 100 | 80 | −20 | 200 | 180 | Material wait recorded; team leader checks the replenishment signal |
| 3 | 100 | 110 | +10 | 300 | 290 | None |
The third hour is 10 units above its own plan, while the shift is still 10 units behind cumulatively. Cumulative attainment after hour three is 290 / 300 × 100 = 96.7 percent. Showing only the third hour would hide the remaining gap.
Variant: hour four again plans 100 and produces 90. The cumulative figures become 380 against 400, or 95 percent, and the gap has doubled to 20 units. The cumulative columns of the LEI form make that drift visible hour by hour.
The extra 10 units in hour three also need context. If they required an unplanned operating change, the team should know that before assuming the recovery can be repeated. A production increase does not permit bypassing a quality or safety requirement.
Turn the Deviation Into a Check
Suppose the 20-unit shortfall in hour two coincides with a recorded material wait. The first action could be to check the replenishment signal and its timing for that period. Assigning "improve logistics" would not specify what will be examined or who will do it.
Record an owner, a due point and the observation expected after the change. If the replenishment timing changes, inspect the next comparable runs for the same waiting condition. Closing the task because a setting was changed does not show that the delay is gone.
Keep unresolved facts separate from accepted causes. "Material wait recorded" is an observation. "The signal was sent too late" needs a time comparison. The board should keep that distinction so a convenient explanation does not become a permanent classification. Whatever the cell cannot resolve in its own huddle goes to the next tier with its owner and due point attached.
Keep the Board Connected to Production Data
A digital display can refresh quantities, but the meaning of each field still needs an owner. If one shift reports total pieces and another reports accepted pieces, the display shows inconsistent performance with precise-looking numbers.
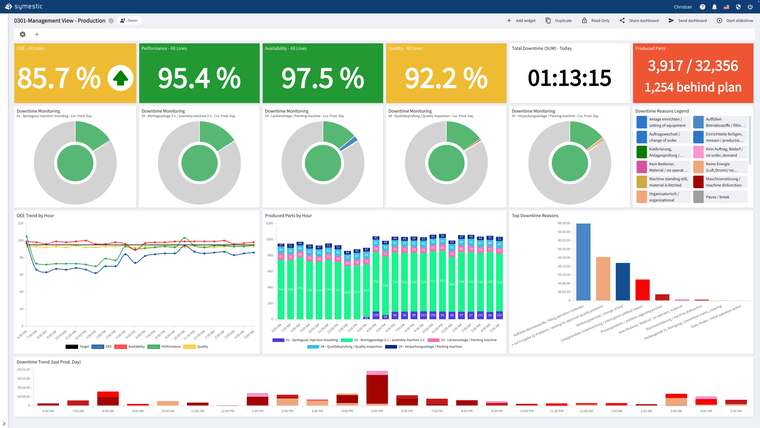
Check the source and update time at handover. Late entries should remain identifiable rather than changing yesterday's result without explanation. SYMESTIC, a cloud MES, records quantities and stops with their reasons per machine and shift and shows them in real-time dashboards, which can fill the plan-versus-actual line of the board. Between two board meetings, an andon signal calls for help at the station. The board itself is one routine within shopfloor management.
Sources
- Lean Enterprise Institute: Production Analysis Board (form)
- Lean Enterprise Institute: Team Board Form (from Getting the Right Things Done)
- Lean Enterprise Institute (Liker, 2025): Three Faces of Lean Management

See hourly quantities and stop reasons per machine, the figures a daily board needs, in a free 30-minute live demo using your own application.
See SYMESTIC on your own use case
In a free live demo, a product expert walks you through the running platform and shows what OEE, downtime and the connection of your machines and ERP look like in practice.
- Live OEE
- Downtime and reasons
- Connecting machines and ERP