


MES Software: Vendors, Features & Costs Compared 2026
MES software compared: vendors, functions per VDI 5600, costs (cloud vs. on-premise) and implementation. Honest market overview 2026.
Machine data collection (MDC) – also referred to as MDA (Manufacturing Data Acquisition) – is the automatic capture of technical operating data directly from machines and equipment: run times, downtimes, cycle times, piece counts, process parameters, and energy consumption – in real time, without manual entry. MDC forms the technical data foundation for KPIs like OEE (Overall Equipment Effectiveness) and is the first step toward transparent, data-driven manufacturing.
For a detailed comparison of MDC software providers, retrofit options, and costs: Production Data Capture Software – Providers, Features & Costs.
Machine data collection (MDC) is the systematic, automatic capture of technical data directly from machines and equipment. Unlike manual capture via shift logs or spreadsheets, MDC delivers objective, second-accurate data about actual machine behavior.
The central question MDC answers: What is actually happening at the machine – not what the ERP plans and not what the operator remembers?
When an operator reconstructs downtimes from memory at the end of a shift, three micro-stops of 90 seconds each, occurring three times per hour, go unreported. That adds up to 4.5 minutes per hour, 36 minutes per shift – invisible productivity loss that never appears in any manual record. MDC eliminates this blind spot.
Modern MDC systems capture every state change the moment it occurs. A machine that stops at 14:23:07 and restarts at 14:25:42 generates a documented downtime of 2 minutes and 35 seconds – automatically, without human intervention. Over weeks and months, this data builds a precise picture of actual machine performance that typically differs from manually estimated values by 10 to 20 percentage points.
MDC is therefore the foundation for any form of production optimization: without reliable machine data, there is no reliable OEE, no sound downtime analysis, and no objective basis for improvement projects.
Fast, clear and scalable.


Machine data falls into five categories. Each category answers a different question about the machine.
Status data answers the question: Is the machine running or not?
Status data is the foundation for the availability factor of the OEE calculation.
Performance data answers the question: Is the machine producing at the intended speed?
A machine running at 108 takt per minute instead of 120 loses 10% performance – often unnoticed for weeks because it is technically "running." Performance data is the foundation for the performance factor of the OEE calculation and the most frequently overlooked loss factor.
Quantity data answers the question: How much was produced – and how much of it is good?
Quantity data is the foundation for the quality factor of the OEE calculation. Accuracy of automatic counting via sensors, light barriers, or PLC signals exceeds 99.99% – a level that manual capture structurally cannot achieve.
Process data answers the question: Under what conditions is production happening?
Process data is the foundation for quality correlations (which parameters cause scrap?), predictive maintenance (which vibration patterns indicate impending failure?), and process optimization (at which settings is output maximized?).
Energy data answers the question: How much energy does the machine consume – and for what?
Energy data is gaining importance due to rising electricity prices and regulatory requirements (energy audits, ISO 50001, CSRD reporting). Many manufacturers discover through automatic energy measurement that individual machines draw 30 to 50% of their full-load consumption while idle.
The benefits of MDC are measurable and typically appear within weeks of implementation.
Production managers see at a glance which machines are running, which are stopped, and why. Not the next day via a spreadsheet – but now, in real time, on a dashboard, tablet, or smartphone. Decisions are based on facts, not estimates.
Without MDC, OEE is an estimate. With MDC, OEE is a measured value. The difference is fundamental: manually estimated OEE values systematically overstate actual values by 10 to 20 percentage points, because micro-stops, speed losses, and short stoppages never appear in memory-based records.
Only automatic capture reveals patterns: downtimes that always occur at the same time of day. Machines whose availability is systematically worse on Friday evenings than Monday mornings. Micro-stops that seem harmless individually but cost hours per week in aggregate. These patterns are the foundation for targeted improvement actions.
TPM, SMED, Kaizen – all Lean methods require reliable data as a starting point. MDC delivers the Pareto of losses: the five causes responsible for 80% of downtime. This tells the improvement team exactly where the biggest lever lies.
Operating hours, switching cycles, vibration trends, temperature curves – MDC delivers the data that enables the transition from calendar-based to condition-based maintenance. Not servicing every 2,000 hours, but when the data indicates a change.
Automatic energy measurement per machine uncovers waste: machines consuming too much power while idle. Peak loads that could be avoided through better scheduling. Compressed air leaks that only become visible through consumption measurement.
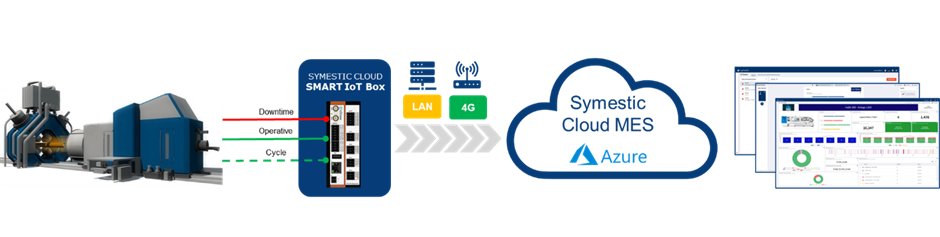
Machine data collection works in four steps: signal capture at the machine, digitization and preprocessing, transmission and storage, visualization and analysis.
Every machine generates electrical signals that reveal its operating state. Modern machines with OPC UA or PROFINET provide this data digitally. Older machines require capture via analog or digital signals:
An IoT gateway at the machine collects signals, digitizes analog values, synchronizes timestamps, and buffers data during network outages. Modern gateways also handle simple logic: "Downtime > 60 seconds → prompt for downtime category" or "Power consumption < threshold → status = idle."
Data is transmitted encrypted via LAN, WiFi, or cellular (4G/5G) to the central platform – directly to the cloud for cloud-native systems, to a local server for on-premise systems. Storage uses time-series databases optimized for querying large volumes of chronological machine data.
Raw data is prepared in dashboards: machine status as traffic-light overview, OEE as shift/day/week trend, downtimes as Pareto chart, cycle times as histogram. Access is browser-based – desktop, tablet, smartphone. No installation, no platform-dependent app.
In a typical mid-sized manufacturing plant, 60 to 80 percent of machines are legacy equipment without modern communication interfaces. Connecting only the newest machines captures one-fifth of the machine park – an expensive monitoring fragment rather than genuine production transparency.
Retrofitting works via IoT gateways that tap electrical signals directly at the machine – without modifying the machine control, without changing PLC programs, and without interrupting ongoing production.
Potential-free contacts are the most universal method. Nearly every machine has relay outputs that indicate operating status: machine running, fault active, automatic mode. These contacts can be tapped without altering the control logic.
Current transformers on the main power supply detect via the load profile whether the machine is producing, idling, or switched off. Completely non-invasive – the sensor is clamped around the cable, not built in.
Counting sensors (light barriers, inductive proximity switches) are retrofitted at the machine output to capture piece counts.
Vibration sensors detect via the vibration profile whether the machine is working under load, spinning idle, or stopped. Particularly useful for machines whose electrical signals are difficult to access.
Installation typically takes two to four hours per machine – including wiring, gateway mounting, and signal testing. The machine delivers data the same day.
For detailed information on gateway types, signal sources, and costs: Production Data Capture Software – Retrofit, Providers & Costs.
More profitable – simply and quickly Efficiency through real-time data KPIs for your success Optimize without capital expenditure.

The three terms often appear in the same context but describe different scopes and capabilities. MDC is the technical entry point, PDA extends to organizational data, MES integrates everything into a control platform.
| Attribute | MDC | PDA | MES |
|---|---|---|---|
| Data focus | Technical machine data (runtime, piece count, cycle time, energy) | Organizational + technical data (orders, personnel, machines, materials, tools) | Comprehensive production data incl. quality, planning, KPIs |
| Goal | Document machine states and make losses visible | Create transparency across the entire production process | Control, optimize, and analyze production in real time |
| Scope | Individual machines or equipment | Shop floor and manufacturing processes | Entire production, cross-site |
| Typical KPIs | OEE, availability, performance rate, MTBF, MTTR | Order progress, staff utilization, setup times per order | OEE + quality, energy, cost, and efficiency metrics |
| ERP integration | Rarely | Partial | Deep bidirectional integration |
MDC answers: How is the machine running? PDA answers: How is the order running? MES answers: How is production running – and how does it get better?
For the transactional perspective on production data capture systems: Production Data Capture Software – Providers, Features & Costs.
Machine data collection is the entry point – but rarely the destination. Most companies start with MDC because the need is concrete: "We want to know why the machine is stopped." Once this transparency exists, further questions arise:
These questions require organizational data (PDA) and control logic (MES). In practice, the typical growth path looks like this:
Stage 1 – MDC: Machine states, OEE, downtime analysis. Value: transparency.
Stage 2 – MDC + PDA: Additionally order assignment, personnel times, setup times. Value: order costing, resource optimization.
Stage 3 – MES: Additionally detailed scheduling, quality management, automated workflows, ERP integration. Value: real-time control of the entire production.
Cloud-native platforms make this transition seamless: machines are already connected, dashboards configured. New functions are activated, not reimplemented. No system change, no data migration project.
For a comprehensive comparison of MES providers and architectures: MES Software – Providers, Features & Costs.
A Tier-1 supplier operates MDC across six plants with over 300 machine segments – press lines, welding systems, assembly areas with heterogeneous controller generations. Standardized IoT gateways enabled connection of both modern OPC UA equipment and older legacy machines without PLC modification. Consolidation to the SEMI E10 standard creates a uniform comparison basis across all sites.
A packaging specialist achieved 12% more output and seven additional production hours per week through MDC implementation – within three weeks of go-live. The gains came from uncovering micro-stops and speed losses that were not captured under manual recording.
A food manufacturer transformed its data capture from manual recording with next-day evaluation to real-time dashboards. Response time to machine disruptions dropped from hours to minutes.
Select three to five machines for the pilot. Criteria: mix of modern and older equipment, known problems (high downtime, unclear OEE), engaged production manager or shift leader on site. Define goals and baseline KPIs: current OEE (estimated), downtime frequency, manual capture effort.
Install IoT gateways, connect signals, configure dashboards. With cloud-native MDC, the first dashboard is available on the day of installation. Make immediate quick wins visible: first downtime report, first measured (not estimated) OEE, first Pareto of loss causes. Experience shows that even the first week produces data points leading to immediately actionable improvements.
Scale to additional lines and plants. Integrate PDA functions (order assignment, personnel times) as the need arises. Connect to ERP for automatic feedback. Continuous improvement through weekly OEE reviews and monthly downtime analyses.
What is machine data collection (MDC)?
Machine data collection is the automatic capture of technical operating data directly from machines: run times, downtimes, cycle times, piece counts, process parameters, and energy consumption. MDC replaces manual capture and delivers second-accurate real-time data as the foundation for OEE calculation, downtime analysis, and production optimization.
What machine data is collected?
Status data (running/stopped/setup/fault), performance data (cycle times, takt rates), quantity data (piece counts, good/scrap), process data (temperatures, pressures, vibrations), and energy data (power consumption, compressed air, peak loads). The specific data depends on the machine connection and available signals.
What is the difference between MDC and PDA?
MDC (Machine Data Collection) captures technical machine data: states, cycle times, piece counts. PDA (Production Data Acquisition) extends the scope to include organizational data: order assignments, personnel times, setup times per order, quality feedback. In modern MES platforms, both are integrated. For a detailed look at production data capture systems: Production Data Capture Software.
Can older machines be retrofitted?
Yes. IoT gateways tap electrical signals directly at the machine: potential-free contacts, current transformers, light sensors. Without modifying the machine control, without PLC programming, and without production interruption. Even machines from the 1980s and 1990s can be connected. Installation takes two to four hours per machine.
What does machine data collection cost?
Cloud-native MDC starts at approximately $900/month for up to five machines. Gateway hardware adds a one-time cost of $500–2,000 per machine. On-premise MES with MDC module requires six-figure upfront investment. ROI for most projects is under six months.
What KPIs does MDC deliver?
OEE (Overall Equipment Effectiveness), availability, performance rate, quality rate, MTBF (mean time between failures), MTTR (mean time to repair), utilization rate, downtime by category, cycle time deviations, and energy consumption per machine.

