



Contents
Production technology covers the manufacturing processes and the equipment used to turn a design into a physical part. It answers two questions. Which process families exist? And which route makes this part at the required material, geometry, quality and quantity? The second question is decided by cost per accepted part, which includes tooling, setup, inspection and rejects, so the route with the cheapest machine hour can still lose.
In German-speaking engineering, processes are classified under DIN 8580:2022-12, Manufacturing processes: terms and definitions, division. The standard sorts them into main groups, groups and subgroups. Teaching material from Ernst-Abbe-Hochschule Jena lists the six main groups below, and the Basics of Manufacturing Technology course at KIT is built on the same groups.
The Six Main Groups of Manufacturing Processes
| Main Group (DIN 8580) | What Happens to the Material | Examples |
|---|---|---|
| 1 Primary shaping | A solid shape is created from shapeless material such as melt or powder | Casting, injection molding, sintering |
| 2 Forming | The shape changes while the material keeps its cohesion | Forging, rolling, deep drawing, bending |
| 3 Separating | Cohesion is reduced locally; material is cut or removed | Shearing, milling, turning, grinding |
| 4 Joining | Workpieces are connected to each other | Screwing, bonding, soldering, welding, riveting |
| 5 Coating | An adhering layer is applied to the workpiece | Painting, electroplating, flame spraying, vapor deposition |
| 6 Changing material properties | The properties of the material change, the shape stays | Hardening, tempering, annealing |
A real route combines several groups. A forged blank (forming) is milled (separating), hardened (changing material properties) and painted (coating). The classification names each step. Choosing between two routes for the same part needs the part requirements and the cost arithmetic below.
Start With the Part Requirement
A housing may be machined from bar stock or forged close to its final shape and then finish-machined. Both routes can end at the same final inspection while using different blanks, fixtures and operations. Compare the complete route to the same accepted condition.
| Question | Evidence to Request | Consequence for Selection |
|---|---|---|
| Can the material be processed? | Material specification and qualified process window | An unsuitable process is excluded before costing |
| Can the geometry be produced? | Access, wall thickness and tool or die concept | Additional operations may be needed |
| Can the requirement be measured? | Inspection method and acceptance rule | Quoted tolerances need a usable verification method |
| Can the volume be delivered? | Cycle, setup, yield and available capacity | Nominal machine speed alone is insufficient |
Work through the questions in this order. A route that fails on material or measurement drops out before anyone prices it, which saves the quotation round for routes that can actually be qualified.
Calculate a Break-Even Quantity
Two routes deliver the same accepted housing. Route A needs $1,000 of one-off preparation and costs $18 per accepted part. Route B needs a $13,000 die and then costs $6 per accepted part. Both figures include the same inspection and finishing scope.
The cost equations are A = 1,000 + 18 × quantity and B = 13,000 + 6 × quantity. The extra die cost is recovered at (13,000 − 1,000) / (18 − 6) = 1,000 parts.
| Quantity | Route A | Route B | Cheaper Route |
|---|---|---|---|
| 500 | $10,000 | $16,000 | A |
| 600 | $11,800 | $16,600 | A |
| 1,000 | $19,000 | $19,000 | Equal |
| 2,000 | $37,000 | $25,000 | B |
Break-even at 1,000 parts does not mean order the die. If you expect to build only 600, route A stays $4,800 cheaper. If a design change is likely before part 1,000, the die may never pay back. State the quantity horizon and who carries the risk of a change before the decision.
Variant: route B's forged blank leaves a burr that needs $3 of deburring per part. Its variable cost rises to $9, and the break-even moves to 12,000 / (18 − 9) = 1,333 parts. One follow-on operation that was missing from the quotation shifts the decision by a third.
Test the Route Beyond the Main Operation
A faster forming step can create extra deburring or straightening work. Those operations consume capacity and change the final cost. Record the sequence through to an accepted part, including movement and waiting where they affect delivery.
For each proposed route, identify the operation that limits output. A short cycle at the headline machine cannot compensate for a slow shared inspection station. The feasibility check should use the expected product mix, not only a dedicated run of one part.
Connect the Process Choice to Production Data
Researchers at NIST (Monnier, Bernstein and Foufou, 2023) align NC code, the instructions a program gives, with MTConnect data that the machine controller records during execution. The two describe different things: what the program intended and what the machine did. A route decision made on quoted cycle times needs the second kind of data once the route runs.
Define the measured unit before comparing alternatives. A machine cycle may contain several parts, while a production order may contain several setups. A report needs the program or operation reference and a clear rule for counting accepted output.
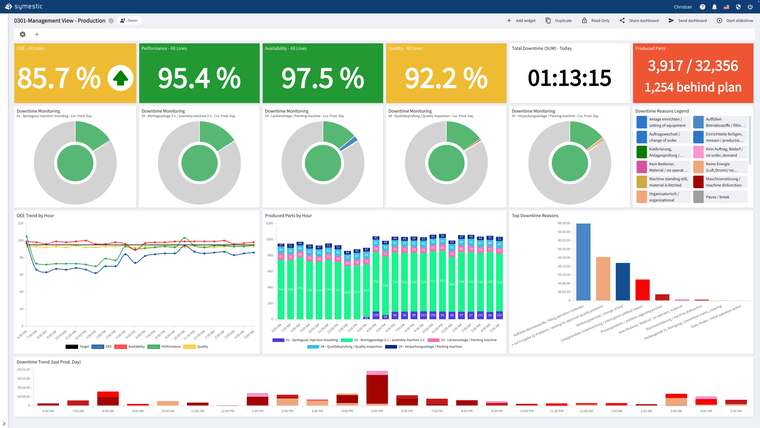
An MES such as SYMESTIC records quantities, rejects and downtime per machine automatically and shows cycle times. With those measured cycle times and reject rates you can recalculate the $18 and $6 per part for your own line. For descriptions of individual process families, see the overview of manufacturing processes.
Sources
- DIN 8580:2022-12: Manufacturing processes - Terms and definitions, division
- EAH Jena (A. Look): Einteilung der Fertigungsverfahren nach DIN 8580, Table 7 (German)
- KIT wbk Institute of Production Science: Basics of Manufacturing Technology
- NIST (Monnier, Bernstein and Foufou, 2023): An automated approach for segmenting numerical control data with controller data for machine tools

See how quantities, rejects and stops are recorded per machine, the figures you need to check your cost assumptions, in a free 30-minute live demo based on your own use case.
See SYMESTIC on your own use case
In a free live demo, a product expert walks you through the running platform and shows what OEE, downtime and the connection of your machines and ERP look like in practice.
- Live OEE
- Downtime and reasons
- Connecting machines and ERP