






MES Software: Vendors, Features & Costs Compared 2026
MES software compared: vendors, functions per VDI 5600, costs (cloud vs. on-premise) and implementation. Honest market overview 2026.

OEE measures how efficiently a machine runs during planned production time. But OEE alone has systematic blind spots: it says nothing about total utilization, system-level losses, or workforce performance. Three complementary KPIs fill those gaps: TEEP (total calendar utilization), OAE (asset effectiveness including organizational losses), and OLE (labor effectiveness). Together, the four metrics form a 360° view of manufacturing performance — from machine to plant to people.
Table of contents
TEEP (Total Effective Equipment Performance) extends OEE by including unplanned time. While OEE only considers planned production time, TEEP measures against the entire calendar — 24 hours a day, 7 days a week, 365 days a year.
Formula:TEEP = OEE × (Planned Production Time ÷ Total Calendar Time)
Or equivalently: TEEP = Availability × Performance × Quality × Loading
where Loading = Planned Time ÷ Calendar Time.
Example: A press achieves 85 % OEE. The plant runs 16 of 24 hours per day (2-shift model).TEEP = 0.85 × (16 ÷ 24) = 0.85 × 0.667 = 0.567 → 56.7 %
The machine uses only 57 % of its total capacity potential. TEEP reveals the hidden capacity: 43 % of calendar time is unused.
When TEEP matters: A company with high OEE but low TEEP has no efficiency problem — it has a capacity utilization problem. Before investing in a new machine, check TEEP first: can the existing one run a third shift?
OAE (Overall Asset Effectiveness) broadens the focus from a single machine to the entire production system. OEE stops at the machine boundary. OAE includes organizational losses that fall outside the machine: material flow delays, logistics bottlenecks, buffer overflows, changeover scheduling, and energy waste between assets.
Formula:OAE = Actual Output ÷ Maximum Possible Output (based on total operating time)
Unlike OEE, OAE uses total operating time as its reference — not just planned production time. This means planned downtime (maintenance, breaks, meetings) also reduces OAE.
Example: A line achieves 90 % OEE. But material delays consume 30 minutes per shift, and planned maintenance takes 1 hour daily. On an 8-hour shift:
Effective production = 8h – 1h (maintenance) – 0.5h (material delay) = 6.5hOAE = (6.5 × 0.90) / 8 = 5.85 / 8 = 0.731 → 73.1 %
When OAE matters: OAE serves plant leadership and management. It answers: "How effectively are we using our total asset base?" — including all the losses that OEE deliberately excludes.
OLE (Overall Labor Effectiveness) transfers the OEE logic to the human factor. Machines don't operate alone. Training, experience, communication, and motivation directly impact production outcomes — but OEE doesn't capture any of it.
Formula:OLE = Availability × Performance × Quality
Example:
Availability (attendance): 95 % · Performance (work speed): 90 % · Quality (error-free): 98 %OLE = 0.95 × 0.90 × 0.98 = 0.837 → 83.7 %
When OLE matters: Two lines with identical OEE can produce different economic results if one team is more experienced. OLE makes this visible. Especially relevant in operations with high manual involvement — assembly, packaging, inspection, quality checks.
One scenario, four perspectives. A stamping press at an automotive supplier:
| Parameter | Value |
|---|---|
| Calendar time per day | 24 hours |
| Planned production time | 16 hours (2-shift) |
| Actual running time | 13.5 hours (1.5h downtime + 1h planned maintenance) |
| Target cycle time | 10 seconds/part |
| Actual output | 4,500 parts |
| Good parts | 4,365 parts (3 % scrap) |
| Operator attendance | 95 % |
| Operator performance | 90 % |
| Operator quality (error-free) | 98 % |
Calculated KPIs:
| KPI | Calculation | Result | What it reveals |
|---|---|---|---|
| OEE | (13.5/16) × (4500/(13.5×360)) × (4365/4500) | ~79 % | Machine runs well during planned time |
| TEEP | OEE × (16/24) = 0.79 × 0.667 | ~53 % | 47 % of calendar capacity is unused — a third shift could nearly double output |
| OAE | Good parts / max possible (24h basis) | ~51 % | Organizational losses (maintenance, material delays) consume half the potential |
| OLE | 0.95 × 0.90 × 0.98 | ~84 % | Team performance is strong; improvement potential in attendance and work speed |
The insight: OEE says "the machine is fine at 79 %." TEEP says "but you're only using half the calendar." OAE says "organizational losses consume as much as machine losses." OLE says "the team is the least of your problems." Four numbers, four different conclusions, one machine.
| Criterion | OEE | TEEP | OAE | OLE |
|---|---|---|---|---|
| Scope | Machine / Line | Plant | Factory / Network | Workforce |
| Time reference | Planned production time | Calendar time (24/7) | Total operating time | Planned labor time |
| Measures | Machine efficiency | Capacity utilization | System-level effectiveness | Human performance |
| Key question | How well does the machine run? | How fully is capacity used? | How efficient is the system? | How effectively does the team work? |
| Includes planned downtime? | No | Yes | Yes | No |
| Typical user | Shift leader, OpEx | Plant manager, COO | Management, strategy | HR, production management |
| You want to know… | Use this metric | Why |
|---|---|---|
| Why is Machine X producing below target? | OEE | OEE isolates availability, performance, and quality losses at machine level |
| Do we need a new machine — or can we run more shifts? | TEEP | TEEP reveals unused calendar capacity before CAPEX is committed |
| Why does the line underperform despite good machine OEE? | OAE | OAE captures organizational losses (material, logistics, changeovers) invisible to OEE |
| Why does Shift A produce 15 % more than Shift B on the same machine? | OLE | OLE quantifies human factors: attendance, skill, error rate |
| How should we allocate improvement budgets across machines, systems, and people? | All four together | Only the combined view shows where the largest losses actually sit |
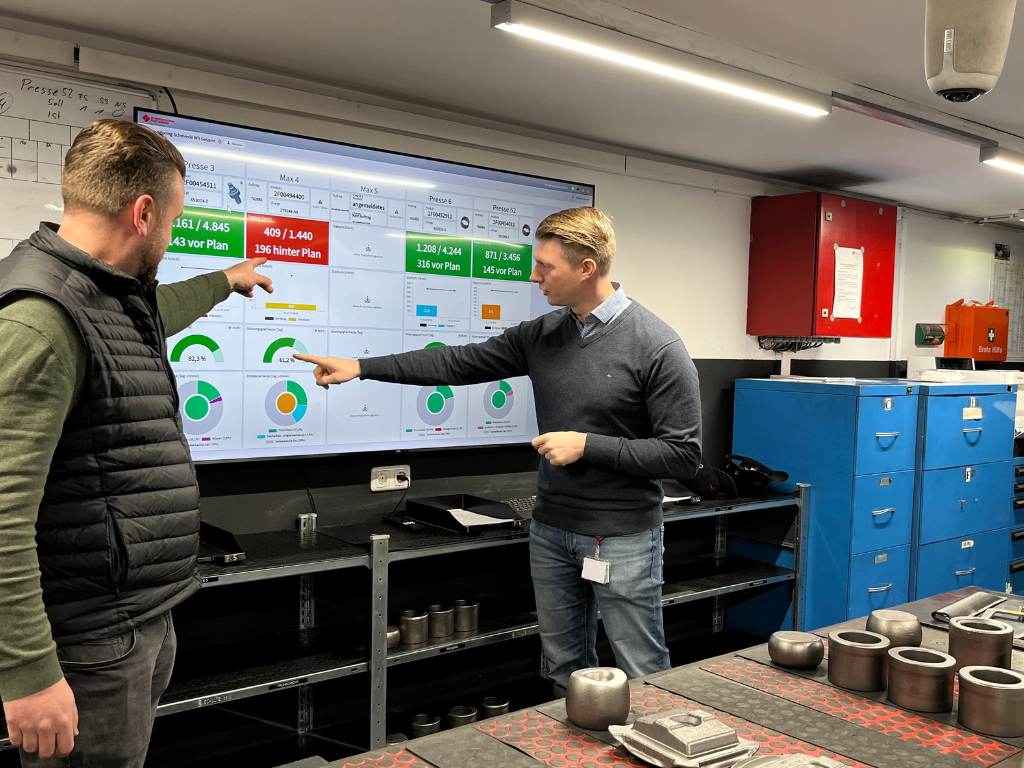
How SYMESTIC implements this: SYMESTIC's cloud-native MES calculates OEE and TEEP automatically from machine signals (OPC-UA, MQTT, digital I/O). OLE data is captured via the Personnel / Headcount module — attendance and order-based time recording per shift. OAE-relevant data (material delays, changeover scheduling) flows through the Fertigungssteuerung module and ERP integration. All four KPIs are visualized on configurable dashboards — from machine-level OEE for the shift leader to plant-level TEEP for the COO.
What is the difference between OEE and TEEP?
OEE measures efficiency during planned production time. TEEP measures against total calendar time (24/7/365). A machine with 85 % OEE running 2 shifts has only ~57 % TEEP — meaning 43 % of calendar capacity is unused.
What is OAE?
OAE (Overall Asset Effectiveness) extends OEE to include organizational losses — material delays, logistics, planned maintenance, changeover scheduling. It measures the effectiveness of the entire production system, not just the machine.
What is OLE?
OLE (Overall Labor Effectiveness) applies the OEE logic to people: Attendance × Work performance × Error-free rate. It quantifies how human factors (training, experience, motivation) affect production outcomes.
Do I need all four metrics?
Start with OEE. Add TEEP when capacity decisions are on the table. Add OLE when shift-to-shift performance varies significantly. OAE is relevant when OEE is high but overall output still disappoints — the losses are then organizational, not technical.
Can an MES calculate TEEP and OLE automatically?
TEEP: yes — it requires OEE (automatic) plus the planned-vs-calendar time ratio (configured in the shift model). OLE: partially — attendance data often comes from HR or time-tracking systems, performance and quality from the MES. A cloud-native MES with REST-API integration connects both data sources.
The key takeaway: OEE is the operational baseline — but it's only one lens. TEEP reveals hidden capacity, OAE reveals system-level waste, and OLE reveals the human factor. The combined view prevents the most common mistake: optimizing machine efficiency while ignoring that the real losses sit elsewhere.
→ What is OEE? · → OEE Formula · → OEE Limits · → OEE Benchmarks · → Improve OEE · → OEE Software

