


MES Software: Vendors, Features & Costs Compared 2026
MES software compared: vendors, functions per VDI 5600, costs (cloud vs. on-premise) and implementation. Honest market overview 2026.
Statistical Quality Control (SQC) is a set of statistical methods used to measure, monitor, and improve manufacturing quality based on process data rather than final inspection alone. Where traditional quality control reacts to defects after they occur, SQC detects variation before it becomes scrap — and gives engineers the evidence to fix the root cause, not just the symptom.
Three elements define SQC:
Used correctly, SQC turns quality from a cost center into a competitive advantage — and it forms the analytical foundation of every modern zero-defect manufacturing program.
Three forces have made SQC non-optional in discrete and process manufacturing:
ISO 9001, IATF 16949 (automotive), and FDA GMP (pharma) increasingly require documented statistical evidence of process capability — not just final inspection records. Auditors expect Cp / Cpk values per critical characteristic, control charts with reaction plans, and traceable data history.
External quality failures cost roughly 10× more than internal ones, and customer-side failures (recalls, warranty, line stops at OEMs) cost 10× more again. Statistical early detection is the cheapest place to find a defect — and the only place where prevention is still possible.
Anomaly detection, predictive maintenance, and AI-assisted root-cause analysis all require clean, statistically structured shopfloor data. SQC is the foundation those models stand on. In practice: manufacturers without a working SQC layer cannot reliably deploy AI in production — the data simply isn't there in usable form.
SQC isn't a single technique — it's a toolbox. The methods below are the ones every quality engineer should know, ordered roughly from most-used to most-specialized.
What it does: Plots a process variable over time against statistically derived control limits (typically ±3σ). When points fall outside the limits — or form non-random patterns — the process is signaling a special cause.
When to use it: Continuous monitoring of any critical-to-quality parameter (dimensions, weights, temperatures, cycle times).
Common mistake: Confusing control limits with specification limits. Control limits describe what the process does; specification limits describe what the customer wants. A process can be in control and still produce out-of-spec parts.
What it does: Quantifies how well a stable process fits within specification limits. Cpk < 1.0 means the process produces defects; Cpk ≥ 1.33 is typically required for serial production; Cpk ≥ 1.67 is automotive-grade.
When to use it: Process release, supplier qualification, PPAP submissions, and any "is this process good enough?" decision.
Common mistake: Calculating Cpk on an unstable process. Capability indices are only meaningful once the process is in statistical control.
What it does: Defines how many parts to inspect from a lot to make a statistically defensible accept/reject decision — without inspecting 100 %.
When to use it: Incoming goods inspection, batch release, destructive testing, and any case where 100 % inspection is uneconomical or impossible.
Common mistake: Treating AQL as a quality target. AQL is a sampling parameter, not a permitted defect rate.
What it does: Structures the search for root causes across the classic 6M categories — Man, Machine, Material, Method, Measurement, Milieu (environment).
When to use it: After an SPC alarm, customer complaint, or capability failure — to move from symptom to cause systematically.
Common mistake: Stopping at the first plausible cause instead of testing the hypothesis with data.
What it does: Ranks defect causes by frequency or cost, applying the 80/20 rule to focus improvement effort where it pays off.
When to use it: Quarterly quality reviews, scrap reduction programs, downtime analysis.
Common mistake: Pareto-charting symptoms (e.g., defect types) without drilling into causes — which leaves the real 20 % invisible.
These three terms are often used interchangeably, but they describe different layers of the quality stack.
| Term | Scope | Primary question it answers | Typical owner |
|---|---|---|---|
| SQC — Statistical Quality Control | Statistical methods applied to process and product data | Is the process capable and stable? | Quality engineering |
| SPC — Statistical Process Control | The real-time monitoring subset of SQC | Is the process drifting right now? | Shopfloor / production |
| QMS — Quality Management System | The organizational system around all quality activity (processes, audits, documentation) | Is the company managing quality the way ISO 9001 requires? | QM leadership |
| MES with quality module | The operational platform that captures the data SQC, SPC, and QMS all depend on | Where does the data actually come from? | Production IT / operations |
In short: SPC is a subset of SQC, SQC is a subset of QMS, and an MES is the operational layer that supplies the data for all three.
Most failed SQC rollouts share the same pattern: too many control charts, too little data discipline. The sequence below avoids that.
Patterns that show up repeatedly in plants starting (or restarting) an SQC program:
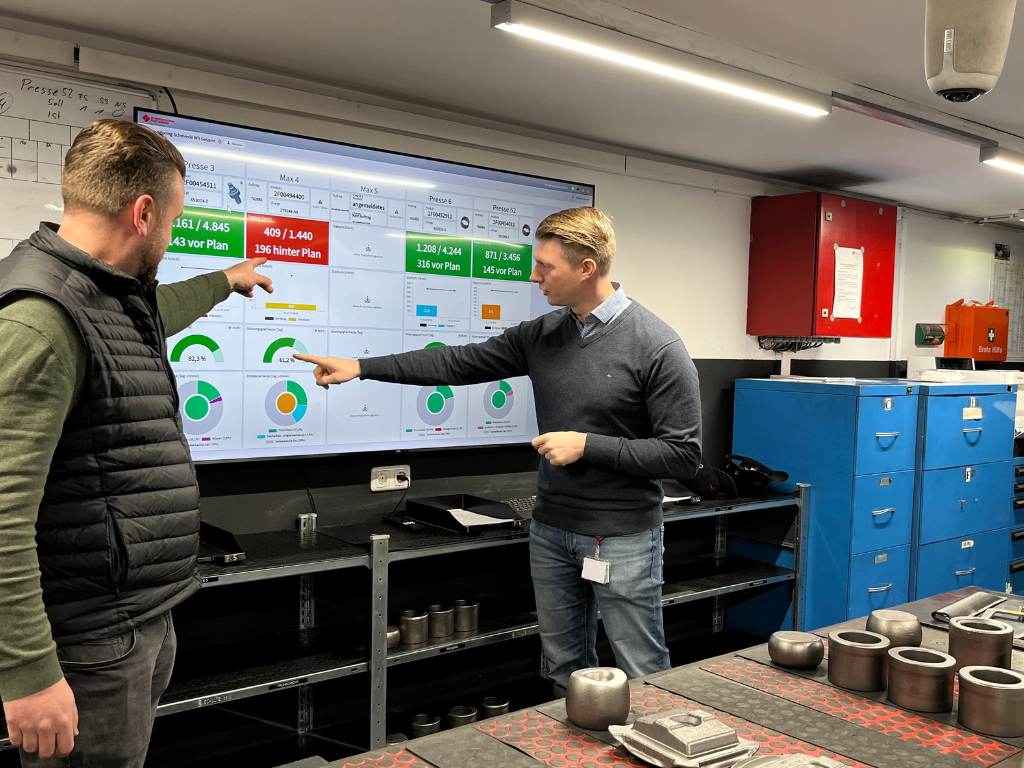
Classical SQC stops at the analysis. SYMESTIC Cloud MES turns it into a continuous, automated loop: data is captured directly from machines and gauges (via OPC UA or digital I/O), KPIs are calculated in real time, and trends are visualized across shifts, lines, and plants.
What changes operationally:
The architectural difference matters: because SYMESTIC is cloud-native (built for Microsoft Azure, not "lifted and shifted"), the first machines are typically connected within hours and the first SQC dashboards are live in days — not the 12–24 months that classical on-premise MES projects need.
SPC (Statistical Process Control) is a subset of SQC. SQC covers all statistical methods applied to quality — including capability analysis, sampling, and Pareto. SPC specifically refers to the real-time monitoring of processes using control charts. Every SPC activity is part of SQC, but not every SQC activity is SPC.
No — SQC can be done on paper or in spreadsheets, and was for decades. But above roughly 50 measurements per shift, manual SQC becomes unreliable: data is delayed, charts age, and operators stop trusting the system. An MES with a quality module makes SQC operationally sustainable rather than theoretical.
The typical thresholds are: Cpk ≥ 1.0 for non-critical characteristics, Cpk ≥ 1.33 for general serial production, and Cpk ≥ 1.67 for automotive and safety-critical features. The exact value should be agreed with the customer or specified in the applicable standard (e.g., IATF 16949 for automotive PPAP submissions).
A focused SQC rollout on a single line — covering measurement system analysis, baseline stability, capability assessment, and live control charts — typically takes 4 to 12 weeks with a cloud-native data platform. Classical, fully manual SQC programs often take 6 to 12 months because data capture, validation, and chart maintenance become the bottleneck.
Yes — and more so than before. AI models for anomaly detection, predictive quality, and root-cause analysis all require structured, statistically clean process data. SQC produces exactly that. Manufacturers without an SQC layer routinely discover, mid-AI-project, that their data is too noisy or too sparse to train on.
Automotive (IATF 16949 mandates statistical capability evidence), pharmaceuticals and medical devices (FDA GMP requires documented process control), aerospace (AS9100), and food & beverage (HACCP-driven monitoring). Any sector with regulated specifications and high cost of failure runs on SQC in some form.
The minimum is: a defined critical-to-quality characteristic, a validated measurement system, and at least 20–25 subgroups of data collected under normal operating conditions. With less than that, control limits and capability values are not statistically reliable.

