




MES Software: Vendors, Features & Costs Compared 2026
MES software compared: vendors, functions per VDI 5600, costs (cloud vs. on-premise) and implementation. Honest market overview 2026.
Schedule adherence — sometimes called production planning adherence, plan attainment, or schedule conformance — is the share of production orders that are completed at the right time, in the right quantity, and in the planned sequence. It is the metric that tells you whether the plan your ERP system published on Monday morning survived contact with the shopfloor by Friday evening. In almost every manufacturing plant I have worked in over three decades of MES and automation projects, it has not.
The reason schedule adherence is a harder metric than it first appears is that it tries to measure three different things at once — quantity (did we produce what the plan said?), timing (did we produce it when the plan said?), and sequence (did we produce it in the order the plan said?). Most dashboards calculate only the first. The quantity-only number is the easy one and the one that looks best. The full three-dimensional measurement is uncomfortable and is what actually matters for cost, lead time and customer experience. A plant that reports 95 % "schedule adherence" on quantity alone can have 62 % adherence on the full three-dimensional measurement, and both numbers are correct under their own definitions.
Schedule adherence is not one number. It is three numbers that a mature plant reports together, because each exposes a different failure mode.
The composite schedule adherence — the single number most often quoted as "the" metric — requires all three to be true for a given order. This is why the composite number is always lower than any individual dimension: a plant with 92 % quantity, 88 % timing and 85 % sequence adherence ends up at roughly 69 % composite, because the failures in each dimension are only partially correlated. Reporting the composite without the three components is the access-control pattern all over again — the aggregate conceals the trade-offs, and the plant cannot tell whether its problem is quantity slippage, cycle-time drift, or sequence chaos.
Four terms that are routinely confused, each answering a different question. Cleaning up the vocabulary is the first step to a usable scorecard.
Schedule adherence is the internal operational metric — how well the plant executes its own plan. OTD and OTIF are the external commercial metrics — how well the plant meets customer commitments. The two can drift apart: a plant can have 85 % schedule adherence and 98 % OTD if the finished-goods warehouse is large enough to absorb schedule slippage. It can also have 95 % schedule adherence and 72 % OTD if the plan itself was wrong — the plant executed the plan flawlessly, but the plan was not aligned with customer promise dates. Both patterns are common, and neither is visible if you track only one of the two metrics.
The technical detail that determines whether a schedule adherence number is meaningful or meaningless: the tolerance window. "Order completed at the planned time" is not an instant — the plan says "complete order 47 on 2026-04-19 at 14:00", and the actual completion happens at 14:37. Does that count? The answer is a policy decision, not a technical fact, and plants that do not make the policy explicit end up with adherence numbers that are not comparable between shifts, sites, or reporting periods.
The three common tolerance rules, in order of strictness:
The discipline that makes schedule adherence comparable over time: the tolerance rule is written down, the same rule is applied across all stations, the rule is not changed mid-period. Plants that quietly widen the tolerance window when adherence numbers look bad produce statistics that cannot be trusted, and auditors notice this within two reviews.
The piece of operational reality that Six Sigma training never teaches clearly: OEE and schedule adherence have a partial inverse relationship, and optimising only for OEE actively degrades adherence. The mechanism is simple. OEE rewards long runs on the same product — every changeover is a performance loss, every setup reduces availability, every small batch inflates the denominator without matching the numerator. A plant that optimises OEE learns, rationally, to cherry-pick long-running orders and push small orders to later, regardless of what the plan says. The result is excellent OEE, badly missed schedule adherence, and a finished-goods inventory that no longer matches what customers ordered.
I have seen this pattern in pressing operations, in CNC machining, in extrusion lines, and in packaging — the specific industry does not matter. The mechanism is the same: whichever metric is displayed on the shift board and escalated to the plant manager is the metric the shift optimises for, and if that metric is OEE alone, schedule adherence will quietly collapse to the 65–75 % range within a few quarters. The fix is not to abandon OEE — it remains a legitimate machine-level metric — but to report OEE and schedule adherence together, at the same level, with the same escalation discipline. Once the scorecard shows both, the cherry-picking behaviour has nowhere to hide and the trade-off becomes a conscious management decision rather than a hidden optimisation.
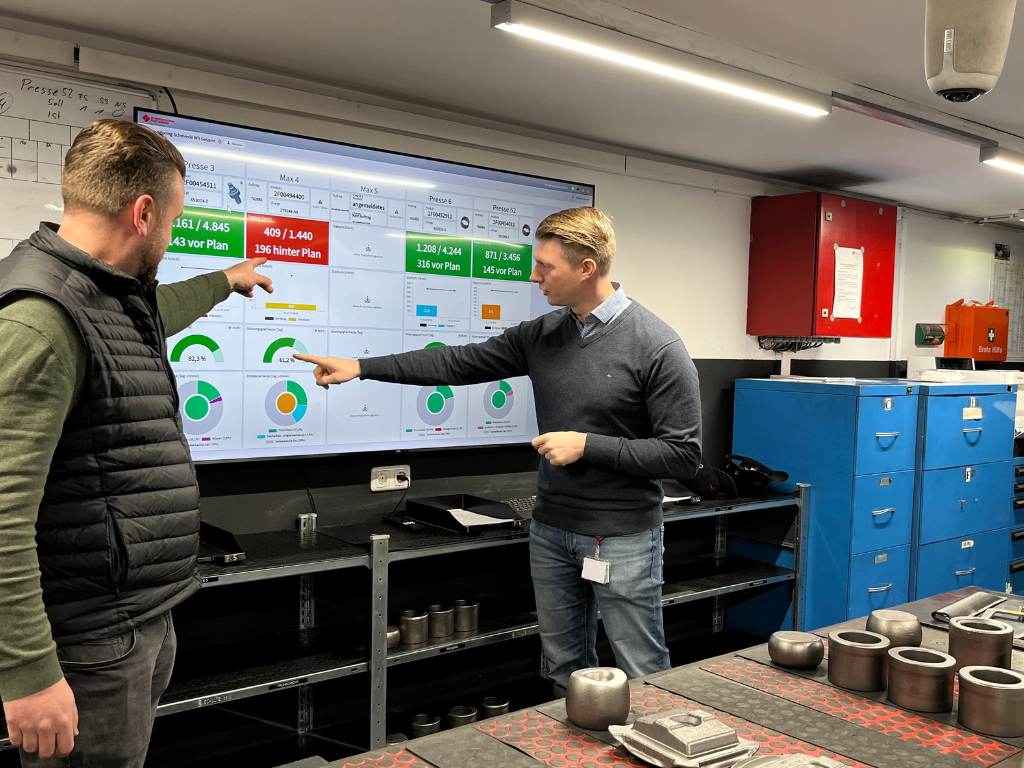
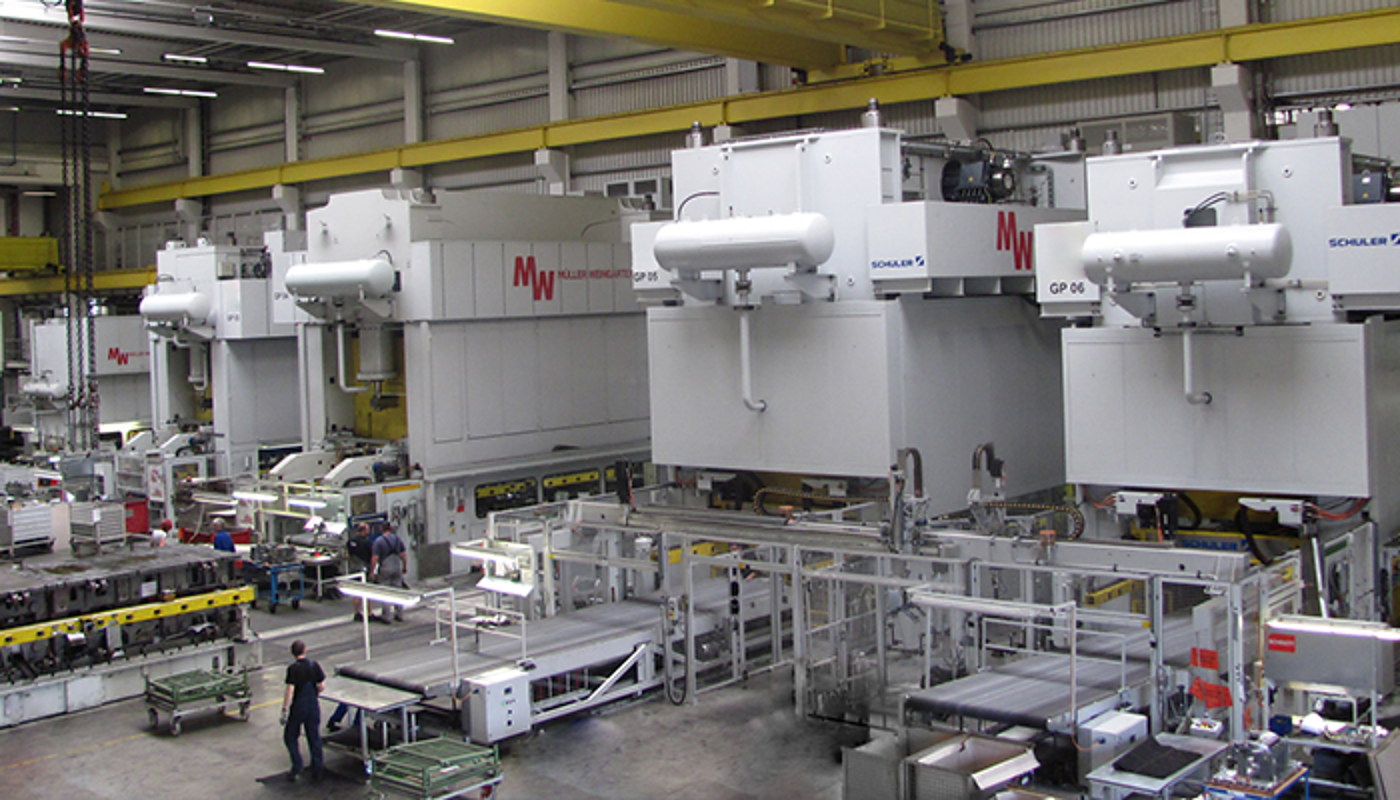
From the SYMESTIC implementation at Schmiedetechnik Plettenberg, 2024: classical high-mix metal-forging operation — variable order sizes, demanding setup sequences, high quality requirements, parallel machine chains running different product families simultaneously. The ERP was InforCOM, the plan landed in the factory in the morning, and by mid-shift reality had diverged from it enough that the printed schedule was no longer a useful document. Order completions were reported manually at shift change, so by the time the ERP saw the feedback it was eight to twelve hours old — too late for any corrective action on the running shift. Schedule adherence as a concept existed in the quality handbook but was never actually calculated, because the data to calculate it reliably was not there. The first thing we built was not a dashboard. The first thing we built was the bidirectional InforCOM↔SYMESTIC connection: order release from the ERP flows in automatically with all relevant operations, machine assignments and time data; completion events, quantities, stoppages and status changes flow back to the ERP in real time, without manual steps. Before this connection, "schedule adherence" was a monthly retrospective — a number the production office calculated from printed schedules and shift logs, usually two weeks too late to matter. After the connection, it became a live shift-level metric that the shift lead could see at the terminal, on the same screen as OEE and downtime. The first two weeks of real data were uncomfortable: quantity adherence was 81 %, timing adherence on a shift-window basis was 64 %, sequence adherence — which nobody had measured before — was 52 %. The plant had not gotten worse; it had only started measuring what was always true. What changed in the next three months was not primarily the number, it was the conversation. The shift handover meeting stopped being "how was the shift?" and became "which planned orders did we miss, and why?" — a different question with a different set of answers. Within four months the composite adherence had moved from about 53 % to about 78 %, and almost none of the improvement came from producing faster. It came from the scheduler stopping to release orders that the plant could not physically execute in the planned window — a feedback loop that requires real-time adherence measurement to exist at all. This is the architectural lesson that is easy to miss behind the dashboard screenshots: schedule adherence cannot be improved if it is not measured in near-real-time, and it cannot be measured in near-real-time without a bidirectional ERP↔MES feedback loop. The KPI is downstream of the integration. Plants that try to improve adherence while still reporting it from paper or spreadsheets are optimising against shadows. Plants that build the ERP↔MES feedback loop first, then display both sides of the plan–execution gap live, find that the number starts moving almost on its own, because the plan and the reality finally have to acknowledge each other at shift-handover cadence instead of monthly.


 Case Study
The failure mode that defeats even good ERP↔MES integration: the plan itself keeps changing. In many mid-market plants the scheduler — sometimes a person, sometimes an APS system, sometimes both — rewrites the production schedule multiple times per day in response to incoming events. A customer escalation arrives at 10:00 and the schedule is rebuilt; a machine goes down at 13:30 and the schedule is rebuilt again; a material shortage surfaces at 15:00 and the schedule is rebuilt a third time. By end of shift the "plan" that the adherence metric is measured against was published 90 minutes ago. Adherence looks excellent — the plan was almost current when execution finished — and the number is meaningless, because the plan was continuously adjusted to match reality rather than reality being driven to match the plan.
Reschedule-thrash is the one pathology that schedule adherence metrics cannot easily detect, because it hides inside the denominator. The defensible counter-measure is freezing the plan at a defined horizon — typically 24 to 48 hours for discrete production — and measuring adherence against the frozen version, not the continuously-updated version. Changes to the frozen plan count as schedule breaks, which are themselves a tracked metric. Plants that adopt this discipline discover within two weeks how many of their apparent "schedule changes" were avoidable if they had not been free, and the plan stability improves measurably because the scheduler has an incentive to let the plan hold.
In Just-In-Time and Just-In-Sequence supply relationships — typical for automotive Tier 1 deliveries, headliner supply, interior trim, painted bumpers, increasingly aerospace structural assemblies — sequence adherence is not one of three dimensions of schedule adherence; it is the dimension. The customer's assembly line runs in a specific vehicle sequence, the supplier delivers parts in the matching sequence, and a single out-of-sequence delivery triggers a line-stop event at the customer that costs €10,000 to €50,000 per minute depending on the OEM and the assembly stage. Quantity and timing matter too, but sequence failures are the ones that generate the escalation calls and the supplier-rating downgrades.
The technical requirement that JIT/JIS places on the MES is stricter than general schedule adherence: every unit produced must be verifiable against a sequence number, the sequence number must flow from the customer's EDI feed (typically DELJIT or VDA-4916 in European automotive) through the ERP into the MES, and sequence violations must trigger an alarm before the unit ships, not after. Plants that run JIT/JIS with only schedule-adherence instrumentation, without sequence-aware enforcement, discover the gap the first time a customer audit reveals that three weeks of deliveries contained sequence errors that never tripped an internal alarm. This is the specific failure mode that ended more than one contract I have seen personally, and it is always avoidable with the right instrumentation.
SYMESTIC captures schedule adherence as a three-dimensional metric — quantity, timing and sequence — with configurable tolerance windows (strict, shift, day) and automatic plan-freezing at the horizon the plant chooses. The metric is driven by the bidirectional ERP↔MES connection that sits at the architectural centre of every deployment: SAP R/3 via ABAP IDoc, Microsoft Dynamics/Navision, Infor/InforCOM (as at Schmiedetechnik Plettenberg), proAlpha — the specific ERP matters less than the fact that order release flows one way and completion feedback flows the other in near-real-time, typically under two minutes end-to-end latency. Without this feedback loop schedule adherence is a retrospective monthly metric; with it, schedule adherence becomes a shift-level management tool. For JIT/JIS deployments the standard adherence framework is extended with sequence-aware enforcement driven from customer EDI feeds, with in-line alarming before ship rather than customer escalation after. On the shopfloor dashboards schedule adherence is displayed side-by-side with OEE, so that the cherry-picking pattern described above cannot establish itself — a design decision that sounds trivial and matters enormously in practice. See also work plan for the master-data structure schedule adherence is measured against, and Rolled Throughput Yield for the quality-side metric that sits on the other axis of the operational scorecard.

 Case Study
What is a good schedule adherence benchmark?
For discrete manufacturing on a shift-window tolerance: composite adherence above 85 % is solid, above 92 % is best-in-class, below 75 % indicates systemic planning or execution problems. For process industries on a day-window tolerance the thresholds are roughly 5 percentage points higher because the looser tolerance forgives more variance. For JIT/JIS operations sequence adherence specifically must be above 99.5 %, because the cost of individual sequence breaks is so high that even a 98 % rate is commercially unacceptable. The worst pattern I have seen in multi-year MES rollouts: plants that report composite adherence above 90 % are usually measuring only the quantity dimension, and the real three-dimensional number is in the mid-70s. The correction is uncomfortable and valuable.
How is schedule adherence different from on-time delivery?
Schedule adherence is measured against the internal production plan — did the plant execute what it planned to execute? On-time delivery (OTD) is measured against the external customer promise date — did the customer receive the order when committed? The two can diverge in both directions: large finished-goods inventory can keep OTD high while adherence slips, and a plan that is not aligned with customer dates can keep adherence high while OTD falls. A complete operational scorecard reports both; optimising only one of the two usually damages the other within two to three quarters.
Why does schedule adherence pull against OEE?
OEE rewards long uninterrupted runs on the same product (fewer changeovers, better availability, better performance). Schedule adherence rewards executing the plan, which in a varied-order environment means many short runs and many changeovers. A plant that escalates only OEE to management creates a rational incentive for shifts to cherry-pick long-running orders and defer small ones, which is exactly the behaviour that destroys adherence. The structural fix is reporting OEE and schedule adherence together at the same escalation level; the cherry-picking pattern has nowhere to hide once both numbers are visible, and the trade-off becomes a conscious choice rather than a hidden optimisation.
What is sequence adherence and when does it matter?
Sequence adherence is the dimension of schedule adherence that measures whether orders were executed in the planned order, not just at the planned time and in the planned quantity. It matters in any environment where downstream processes depend on the upstream sequence — JIT/JIS automotive supply is the canonical example, but sequence also matters in assembly lines with changeover-sensitive tooling, in paint shops where colour sequence drives material efficiency, and in any context where buffer inventory is deliberately small. For JIT/JIS specifically, sequence adherence above 99.5 % is the minimum commercial requirement, because each sequence break can trigger a line-stop at the customer that costs €10,000+ per minute.
What tolerance window should I use for schedule adherence?
Shift-window (8 or 12 hours) is the standard for discrete manufacturing — it forgives hour-level variance without letting shift-level drift hide. Strict (exact hour) is only useful in paced takt-time assembly; in non-paced production it always reads below 30 % and stops being informative. Day-window is typical for process industries and batch operations where intra-day timing is less meaningful than daily volume. The specific window matters less than consistency: pick one rule, apply it across all stations, do not widen it mid-period to make the number look better. Auditors detect tolerance-shopping within two review cycles and it damages the credibility of the entire scorecard.
How real-time does adherence measurement need to be?
For retrospective improvement analysis, end-of-shift is sufficient. For tactical management — the shift lead actually using adherence to make decisions within the shift — the latency has to be under about 15 minutes, which in practice means automated ERP↔MES feedback rather than manual reporting at shift change. Plants that calculate adherence only monthly from printed schedules can describe their past; they cannot change their present. The single largest leverage point in improving adherence is usually not the scheduling algorithm or the operator discipline but the measurement latency: faster feedback enables both better operator decisions in-shift and better scheduler decisions at the next horizon.
Can schedule adherence be measured without ERP integration?
Nominally yes, using the MES's own order backlog as the plan; practically no. Without ERP integration the MES plan is a shadow copy that drifts from the ERP plan within hours, and "adherence" becomes adherence to a version of the plan that purchasing, sales and finance don't recognise. The useful schedule adherence metric is always adherence to the ERP-published plan with MES-captured actuals, which means bidirectional integration is the architectural prerequisite for the KPI to have any cross-functional meaning. Standalone MES deployments can calculate adherence internally, but the number does not stand up in cross-functional reviews because the counterparties do not accept the plan it is measured against.
Related: OEE: definition, calculation & practice · MES: definition, functions & benefits · OEE software · MES software compared · Rolled Throughput Yield (RTY) · Scrap rate vs. rework rate · Work plan · Recipe management · Change control · Role-based access control · BOM explosion · Detailed scheduling · Production control module · Production metrics module · Automotive · Metal processing · Food & beverage · Plastics processing · For production managers · For operational excellence · For COOs & plant managers. External reference: ASCM/APICS Dictionary (the canonical public reference for production planning and scheduling terminology).

