




Contents
- Why do most companies use OEE wrong?
- What is the OEE formula?
- What do the three OEE factors measure?
- How to calculate OEE step by step: a worked shift example
- What is a good OEE value?
- What are the Six Big Losses?
- What is the Hidden Factory?
- Why does spreadsheet-based OEE not work?
- How do you improve OEE in practice?
- Why does OEE need an MES?
- What an OEE system or OEE dashboard has to show
- What metrics complement OEE?
- What does OEE not measure?
- FAQ
Overall Equipment Effectiveness (OEE) is the standard manufacturing metric that measures production productivity using the formula: Availability × Performance × Quality. 85% OEE is the global "world-class" benchmark.
The metric’s real power lies in exposing the Six Big Losses and unlocking the Hidden Factory (untapped capacity). However, manual spreadsheet tracking misses critical micro-stoppages—true operational improvement requires real-time, automatic data capture via a Manufacturing Execution System (MES).
Table of contents
- Why do most companies use OEE wrong?
- What is the OEE formula?
- What do the three OEE factors measure?
- What is a good OEE value?
- What are the Six Big Losses?
- What is the Hidden Factory?
- Why does spreadsheet-based OEE not work?
- How do you improve OEE in practice?
- Why does OEE need an MES?
- What metrics complement OEE?
- What does OEE not measure?
- FAQ
Why do most companies use OEE wrong?
Every production manager knows the OEE formula. The calculation is trivial. And yet most companies fail to use OEE as an effective management tool.
The problem is not the metric itself. The problem is how it is applied. A recurring pattern emerges: companies measure OEE, but they do not improve it. The OEE value gets recorded in a spreadsheet, shown once a week in a production meeting and then forgotten. The actual root causes of losses remain invisible because data collection is manual, delayed or incomplete.
This article does not just explain the OEE formula. It shows how OEE works in practice, where the metric falls short and what separates companies that measure OEE from those that use it to demonstrably improve their production.
What is the OEE formula?
OEE = Availability × Performance × Quality
The three factors are each expressed as a percentage and multiplied together. This creates a cumulative effect: even when each individual factor looks acceptable, the resulting OEE can be significantly lower than expected.
| Factor | Example value |
|---|---|
| Availability | 90 % |
| Performance | 92 % |
| Quality | 97 % |
| OEE | 80.3 % |
Most production managers who see these individual values would intuitively say: "That's running fairly well." The OEE value shows the reality: almost 20 % of planned production capacity is lost. That is precisely the strength of the metric — it prevents hiding behind individual factors and forces a holistic view.
What do the three OEE factors measure?
| Factor | What it measures | Formula | Typical losses |
|---|---|---|---|
| Availability | Proportion of planned time the machine actually runs | Operating Time ÷ Planned Production Time | Breakdowns, material shortages, tool changes, setup |
| Performance | Whether the machine runs at intended speed | (Ideal Cycle Time × Parts Produced) ÷ Operating Time | Micro-stoppages, slow cycles, uncalibrated parameters |
| Quality | Proportion of good parts vs. total parts | Good Parts ÷ Total Parts Produced | Scrap, rework, start-up rejects |
In practice: Availability is the factor with the greatest improvement leverage in most discrete manufacturing. When companies first introduce automatic downtime tracking, the measured availability typically falls noticeably below what the team had previously estimated — not because production got worse, but because micro-stoppages and brief interruptions were simply never documented before.
Performance losses are the least understood factor. A machine is not standing still — it is producing, just 8 % slower than it could. The quality factor in most discrete manufacturing exceeds 95 %, sometimes 98 %. That sounds comfortable but at 10,000 parts/day, 2 % scrap means 200 defective parts, every day.
For a detailed analysis of all three factors with practical examples: → The OEE Factors Explained
How to calculate OEE step by step: a worked shift example
To calculate OEE you need five inputs from one shift: planned production time, stop time, ideal cycle time, total count and good count. The method follows the definition of the Lean Enterprise Institute, which multiplies availability rate, performance rate and quality rate. The numbers below are invented for illustration.
| Step | Calculation | Result |
|---|---|---|
| 1. Planned production time | 480 min shift minus 30 min planned break | 450 min |
| 2. Run time | 450 min minus 45 min of stops (25 min breakdown, 20 min setup) | 405 min |
| 3. Availability | 405 min ÷ 450 min | 90.0 % |
| 4. Performance | 36 s ideal cycle time × 621 parts ÷ 24,300 s run time | 92.0 % |
| 5. Quality | 602 good parts ÷ 621 parts | 96.9 % |
| 6. OEE | 90.0 % × 92.0 % × 96.9 % | 80.3 % |
A one-step check catches typing errors: good parts × ideal cycle time ÷ planned production time. Run time and total count cancel out in the multiplication, so the result must be the same. Here, 602 × 36 s gives 21,672 s of ideal production time. Divided by 27,000 s of planned production time, that is again 80.3 %. If the two results differ by more than rounding, one input is wrong.
Four errors that distort the OEE calculation
- Planned breaks left in the base. If the 30 minutes of break count as planned production time, availability drops for a reason the line cannot change. Decide once which planned stops leave the base, and apply the rule to every machine.
- Average cycle time instead of ideal cycle time. If the measured average serves as reference, performance comes out at 100 % by definition, and slow running disappears from the number. If performance is ever above 100 %, the reference cycle time is too slow.
- Reworked parts counted as good. The quality rate counts losses from scrap and rework. A part that needs rework is not a good part, even if it is shipped later.
- Setup booked as planned time. If setup leaves the base like a break, availability looks better, and shorter changeovers no longer show up in OEE.
What is a good OEE value?
The frequently cited "85 % world class" originates from the TPM literature of the 1980s and refers to individual machines in series production. As a blanket target for every industry and machine type, it is misleading.
| Production type | Good | Average | Why structurally different |
|---|---|---|---|
| Series manufacturing (automotive, plastics, metal) | 75–85 % | 55–65 % | Long runs, stable setups |
| Batch & food production | 60–70 % | 45–55 % | Product-specific setups, cleaning cycles |
| Small-batch / job-shop | — | — | High setup ratios depress OEE structurally — the metric is less meaningful here |
The critical point: an OEE value is only meaningful when compared with itself over time. Whether a machine improves from 62 % to 71 % matters more than whether 71 % is "good". The trend shows whether improvement measures are working.
In-depth industry comparisons: → OEE Benchmarks
What are the Six Big Losses?
The Six Big Losses framework originates from Seiichi Nakajima's TPM concept (1988) and maps all productivity losses to the three OEE factors.
| # | Loss type | OEE factor | Examples |
|---|---|---|---|
| 1 | Equipment failure | Availability | Breakdowns, tool breakage, unplanned repairs |
| 2 | Setup & adjustments | Availability | Tool changes, format changeovers, cleaning |
| 3 | Idling & minor stops | Performance | Sensor faults, infeed jams, short interruptions |
| 4 | Reduced speed | Performance | Wear, incorrect settings, material variation |
| 5 | Process defects | Quality | Scrap during regular production |
| 6 | Start-up losses | Quality | Rejects during ramp-up after changeover |
In practice, the largest losses nearly always come from micro-stoppages and setup times, not from quality problems.
Full analysis of all six loss types: → Six Big Losses
What is the Hidden Factory?
The "Hidden Factory" describes untapped production capacity concealed within existing equipment. The premise: before buying new machines or adding a shift, eliminate losses in the existing production first.
A line running at 60 % OEE across three shifts has a theoretical Hidden Factory of 40 %. If losses are halved and OEE rises to 80 %, that is equivalent to the capacity of half an additional shift — without any investment in new equipment.
Why does spreadsheet-based OEE not work?
Most manufacturing companies start with manual OEE tracking. The problem is not the effort — it is data quality. Manual collection has three systematic weaknesses:
| Weakness | What happens | How automatic capture solves it |
|---|---|---|
| Time delay | A stoppage at 14:22 gets documented at 16:00 during shift handover — useless for real-time response | Machine signals captured in real time |
| Subjectivity | Same root cause classified as "material defect" by one operator and "machine fault" by another | Standardized downtime categories |
| Invisible losses | Micro-stoppages under 2 minutes almost never captured manually — often 5–10 % of total losses | Every interruption recorded including sub-minute stops |
The difference between manual and automatic capture is not incremental — it is fundamental.
What OEE software delivers and costs: → OEE Software Compared
How do you improve OEE in practice?
| Phase | Timeframe | Goal | What happens |
|---|---|---|---|
| 1. Transparency | Weeks 1–4 | Know the actual OEE | Connect machines, start automatic capture. The team sees the real OEE for the first time — it is almost always below expectations. That is the necessary baseline, not the problem. |
| 2. Eliminate top losses | Months 2–3 | Measurable improvement | Prioritize the now-visible losses. Production, maintenance and quality jointly analyze top-5 root causes and develop countermeasures. |
| 3. Continuous steering | From month 4 | OEE as management tool | Daily dashboards in shopfloor management, weekly OEE reviews, monthly trend analysis. Improvement is a cycle, not a project. |
For the full methodology: → How to Improve OEE
Why does OEE need an MES?
OEE as a concept works with pen and paper. OEE as a management tool works only with automatic data collection, real-time dashboards and standardized loss analysis — in other words, with an MES (Manufacturing Execution System).
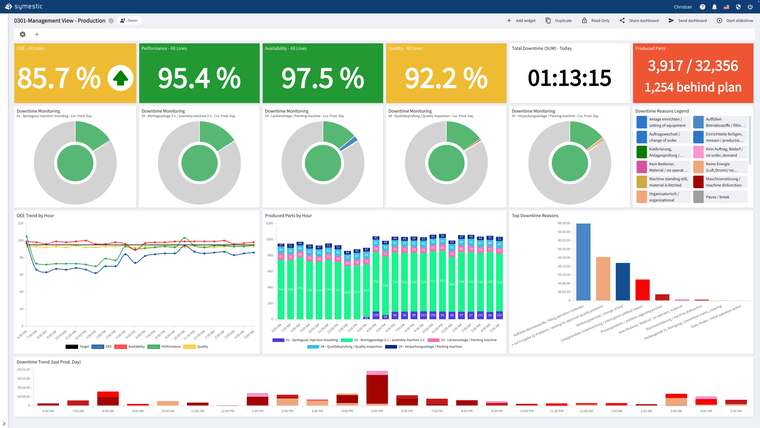
An MES captures machine and production data automatically, calculates OEE in real time, visualizes downtime causes in dashboards and makes improvements measurable. Cloud-native MES platforms like SYMESTIC enable the start of automatic OEE capture within hours, not months.
Data collection begins with machine connectivity. Machine Data Collection (MDC) delivers cycle times, stoppages and performance data directly from the equipment. Production Data Collection (PDC) adds order, shift and personnel data. Together they form the basis for a complete OEE calculation.
→ What is an MES? · → Cloud MES
What an OEE system or OEE dashboard has to show
An OEE system, OEE dashboard or OEE tracking software is only as good as the inputs it collects. The checks below follow from the formula and the errors above. They apply to any tool, a spreadsheet included.
| Check | Why it matters |
|---|---|
| Stops recorded with start and end time from the machine signal | Short stops that nobody notes by hand are a loss the shift otherwise never sees |
| A fixed list of stop reasons | Only then can losses be ranked, for example in a Pareto chart of lost minutes |
| An ideal cycle time per product, not only per machine | A machine that runs two products at different speeds otherwise shows a false performance loss |
| Availability, performance and quality next to OEE | The same OEE can come from very different losses. The factors show which one to work on |
| Views per shift, order and machine | A weekly plant average hides the shift or product where the loss happens |
| Scrap and rework booked with a reason | Quality losses can be traced back instead of showing up as one percentage |
The OEE software page shows how SYMESTIC records stops, stop reasons and scrap.
What metrics complement OEE?
| Metric | What it adds beyond OEE | When to use |
|---|---|---|
| TEEP | Includes total calendar time — shows unused capacity including planned stoppages | "Do we need a new machine or can we run more shifts?" |
| OAE | Total available time without external factors — closer to financial perspective | "How well am I utilizing my asset base?" |
| OLE | Applies OEE logic to workforce: attendance × productivity × quality | "Is the team a bottleneck or an enabler?" |
Full comparison with formulas: → OEE, TEEP, OAE and OLE Compared
What does OEE not measure?
OEE is a powerful tool, but not a comprehensive one. It does not measure energy efficiency — a machine can run at 85 % OEE while consuming 30 % more energy than necessary. It does not measure delivery performance — a line can be highly efficient while producing the wrong product. It does not measure workforce strain — high OEE achieved through overtime is not sustainable.
OEE should never be viewed in isolation but embedded in a KPI system that also includes delivery performance, cost per unit, energy consumption and quality metrics. An MES with configurable dashboards makes exactly this possible.
In depth: → The Limits of OEE
FAQ
What does OEE stand for?
OEE stands for Overall Equipment Effectiveness. The metric measures how effectively a production asset is utilized by combining availability, performance and quality into a single percentage value.
How is OEE calculated?
OEE = Availability × Performance × Quality. Each factor is expressed as a percentage. With 90 % availability, 92 % performance and 97 % quality, the resulting OEE is 80.3 %.
What is a good OEE value?
That depends on industry and machine type. In series manufacturing, 75–85 % is considered good. The internationally cited world-class benchmark is 85 %, but this is not universally applicable. What matters most is the trend over time, not an absolute target.
What are the most common OEE losses?
Micro-stoppages and setup times cause the largest losses in most manufacturing environments. Quality issues are often the smallest factor. The Six Big Losses framework distinguishes six loss types mapped to availability, performance and quality.
How are OEE and MES related?
An MES automatically captures the machine and production data needed for OEE calculation in real time. Without automatic data collection, OEE relies on manual estimates and loses its value as a management tool.
What does OEE tracking cost?
On-premise systems typically require six-figure upfront investments. Costs depend on machine count, feature scope and architecture.
What is the difference between OEE and TEEP?
OEE refers to planned production time. TEEP refers to total calendar time and therefore also captures losses from planned stoppages such as weekends or maintenance windows.
Can I track OEE with Excel?
In principle yes, but in practice manual collection leads to delayed, subjective and incomplete data. Micro-stoppages are almost never documented. Automatic capture via an MES delivers fundamentally better data quality.
The bottom line: OEE is the most important operational metric for machine productivity — but only if it drives action. Measuring without improving is waste. The path: automatic data capture first, then identify the dominant loss factor, then eliminate it systematically. Repeat.
→ OEE Formula · → OEE Benchmarks · → How to Improve OEE · → OEE Software · → TEEP, OAE & OLE · → Limits of OEE
Potential analysis30 minutes · free
Find your hidden factory and its euro value
In a free 30-minute call we go through downtime, changeovers and scrap with your own figures and calculate what they cost you per year.
In use in over 20 countries


Loss statementYour plant
Live demo30 minutes · free
See SYMESTIC on your own use case
In a free live demo, a product expert walks you through the running platform and shows what OEE, downtime and the connection of your machines and ERP look like in practice.
In use in over 20 countries
Use caseOEE software
Your OEE live, not in Excel at month-end
SYMESTIC measures availability, performance and quality right at the machine. The first machine is connected in under three hours, even an older one.
In use in over 20 countries

Customer StoryAutomotive · PDF
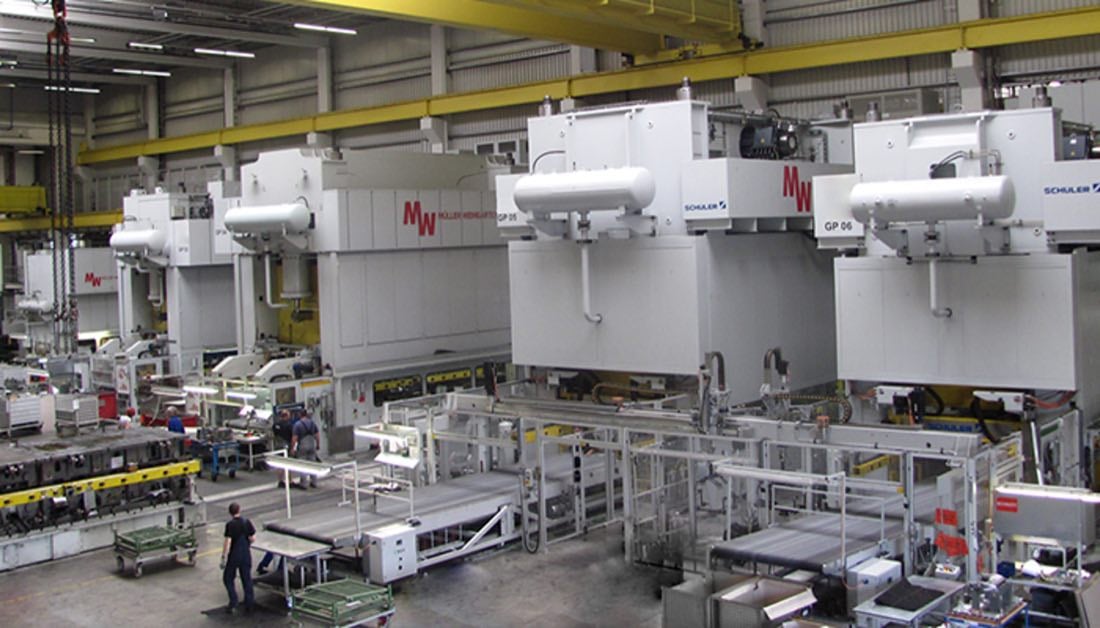
How Meleghy Automotive connects its plants with a single MES platform
- −10 %downtime
- +7 %output
- 4 plantsin six months
 Case Study

Six Sigma Black Belt with more than 25 years in manufacturing, previously at Johnson Controls, Visteon, iTAC and Dürr.
Book: „OEE: Eine Zahl, viele Lügen“ (2025)
- Manufacturing Execution Systems (MES)
- OEE
- Shopfloor Digitalization
- Six Sigma (Black Belt)
Updated
All articles by Christian Fieg