



TEMPLATE
Downtime log: Excel template
Use this template to log every stop per shift and see which reasons cost the most time.
Download the template
What is in the template
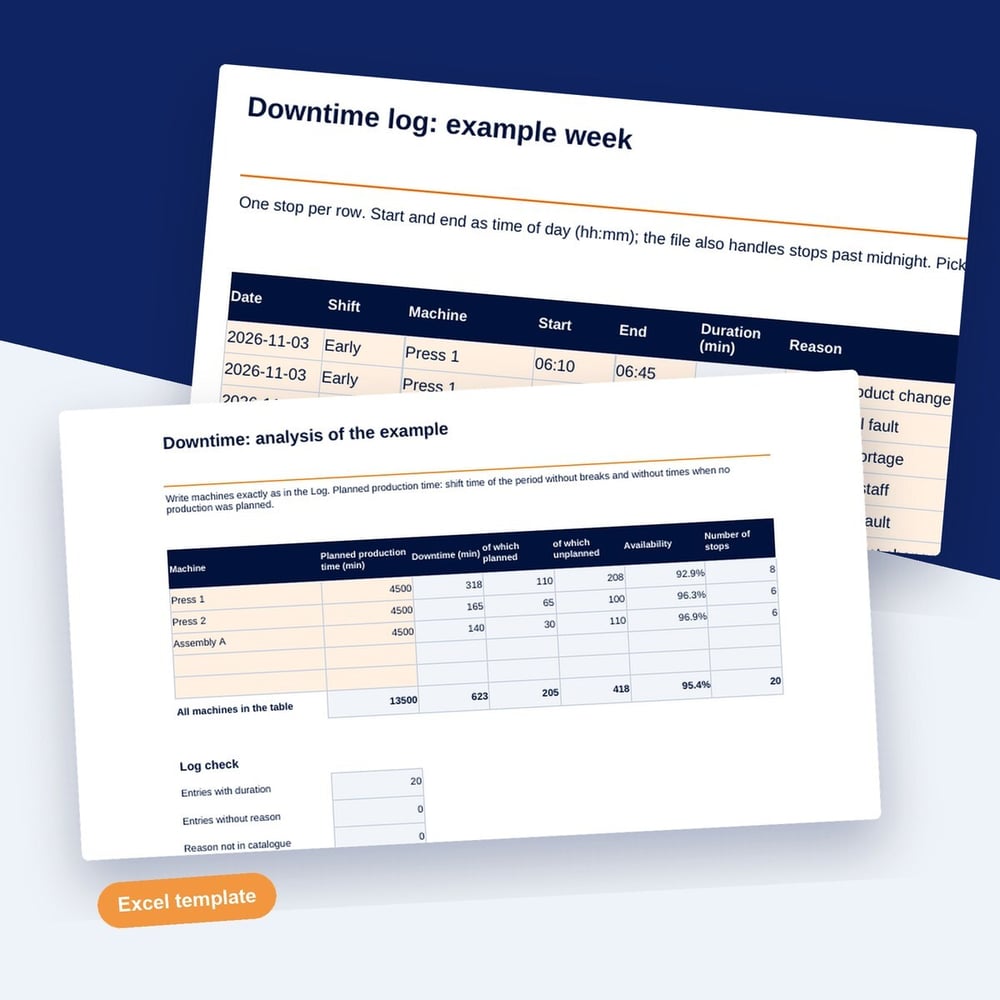
You enter start, end, machine and reason, and Excel calculates the duration. The analysis shows availability per machine and ranks the reasons by minutes.
- Log per shift with start, end, machine and reason; Excel calculates the duration
- Catalogue of downtime reasons, split into planned and unplanned
- Availability per machine from planned production time and downtime
- Pareto chart of the reasons by minutes, plus a filled-in example week
If you no longer want to write stops down by hand: SYMESTIC, the cloud-native MES, detects downtime automatically, from the machine signal or when parts stop being counted. In a free 30-minute live demo, we show you SYMESTIC on your own use case.
Who it is for
Who the downtime log is for
The downtime log is for production managers, shift supervisors and maintenance teams who want to know where machine time is lost before they decide what to fix first. It suits one machine or a small group of machines for a few weeks of logging by hand.
How to work with the downtime log
- 1
Set the reasons
Check the reason catalogue and keep it short. Mark each reason as planned or unplanned.
- 2
Log every stop
Enter start, end, machine and reason, ideally during the shift. Stops past midnight are calculated correctly.
- 3
Read the analysis
Enter planned production time per machine and read availability and the Pareto chart of reasons by minutes.
What makes a downtime log useful
A short catalogue gives clear answers
With too many reasons, operators pick the first one or other. Ten to fifteen clearly separated reasons make the Pareto chart meaningful.
Short stops get lost on paper
Stops of a few minutes are rarely written down by hand. Expect the log to show the long stops well and to underestimate the short ones.
Minutes matter more than counts
A reason that occurs often but briefly can cost less time than a rare long stop. Rank the reasons by minutes before you choose the first action.
How to
How to set up a machine downtime log
A downtime log records every stop of a machine with date, shift, start, end, duration and reason. Add whether the stop was planned or unplanned and a short comment. From these entries you calculate downtime per reason and availability: availability = (planned production time minus downtime) ÷ planned production time. A few weeks of entries show which reasons cost the most.
Write the entry when the stop ends, not at the end of the shift. Entries written from memory round times and merge several short stops into one. Use the same clock for start and end and let the file calculate the duration. Enter each stop once, even when two reasons apply, and choose the reason that started the stop.
Review the log every week with production and maintenance. Sort the reasons by minutes, take the largest one, and agree on one action with an owner. After the action, keep logging for another few weeks to see whether the minutes for that reason go down. A log that is filled in but never reviewed loses the support of the operators within weeks.
Example
Example: one week on a packaging machine
The machine runs two shifts of 7.5 hours on five days, which gives 4,500 minutes of planned production time. Sample values from one week:
| Reason | Stops | Minutes | Cumulative share |
|---|---|---|---|
| Changeover | 6 | 210 | 37.1% |
| Material missing | 9 | 135 | 61.0% |
| Tool breakage | 2 | 95 | 77.7% |
| Waiting for quality release | 7 | 70 | 90.1% |
| Jam, minor fault | 14 | 56 | 100.0% |
The week has 566 minutes of downtime, so availability is (4,500 minus 566) ÷ 4,500 = 87.4%. Changeovers and missing material cause 61% of the lost minutes, which makes them the first two topics for the weekly review.
Questions and answers
Common questions about downtime logs
What is the difference between planned and unplanned downtime?
Planned downtime is scheduled in advance, such as changeovers, planned maintenance or cleaning. Unplanned downtime happens without notice, such as breakdowns, missing material or waiting for staff. Both reduce availability in OEE, but they call for different actions: planned stops are shortened, unplanned stops are prevented.
How do you calculate the downtime percentage?
Divide the downtime by the planned production time and multiply by 100. In the example, 566 ÷ 4,500 gives 12.6%. Availability is the remaining share, 87.4%. Use the same planned production time for both figures, or they will not add up to 100%.
Can you calculate MTBF and MTTR from a downtime log?
Yes, for stops caused by failures. MTTR is the total repair time divided by the number of failures. MTBF is the operating time divided by the number of failures. Leave changeovers, missing material and other stops without a technical failure out of both figures.
How long should you log downtime by hand?
Long enough that the ranking of the top reasons stops changing from week to week, which often takes three to four weeks for one machine. After that, the log is mainly useful to check whether an action worked. For continuous tracking, manual entry becomes a burden for operators.
Who should fill in the downtime log?
The operator at the machine, because only the operator sees when a stop starts and why. The shift supervisor checks the entries at the end of the shift and completes missing reasons. Maintenance adds the repair details for technical failures.
Further reading
Download the downtime log
Fill in the short form and you receive the download right after.