



TEMPLATE
Energy KPIs per machine: Excel template
Calculate kWh per good part and idle load for each machine from your own meter readings.
Download the template
What is in the template
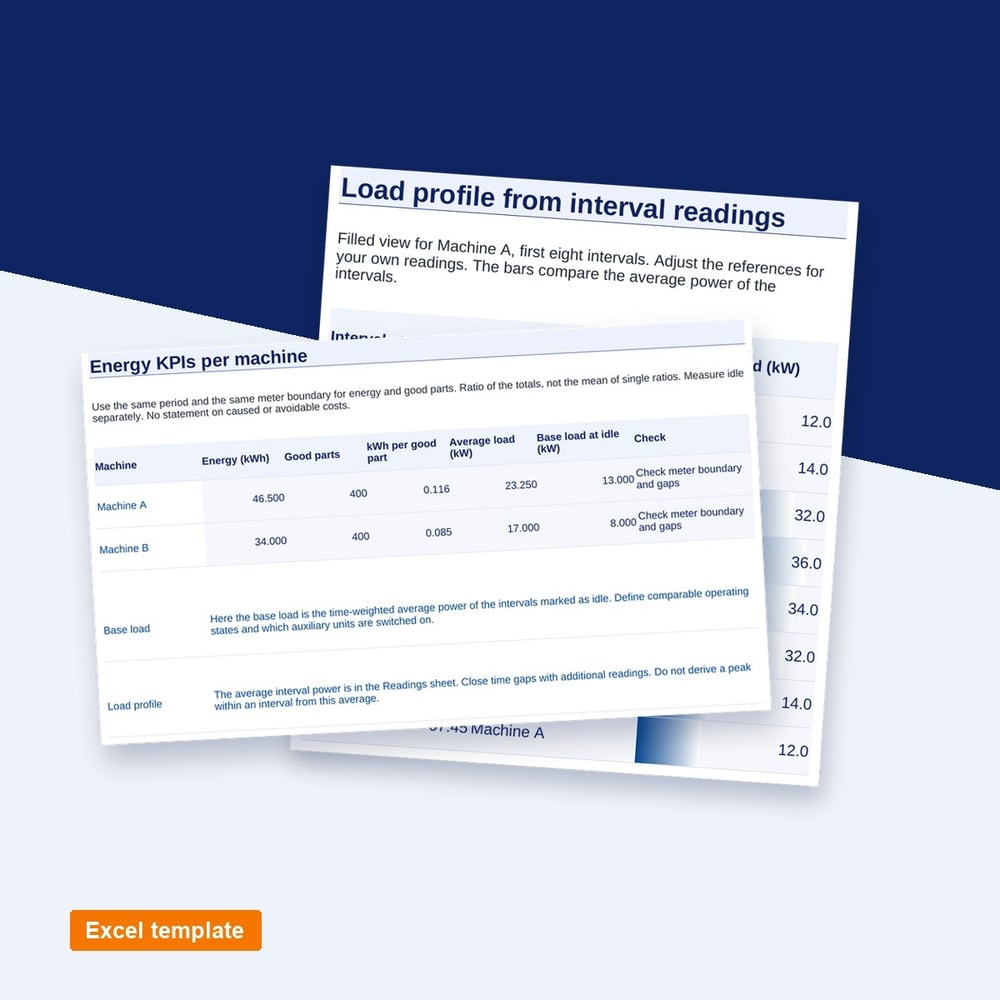
You record start and end meter reading, time, operating state and good quantity. Excel calculates consumption and average power per interval. The summary relates total consumption to good parts.
- Meter log with readings, time intervals and good quantity
- kWh per good part and time-weighted idle base load per machine
- Load profile from interval values with data bars
Who it is for
Who the energy KPI template is for
The template is for energy managers, production managers and maintenance teams who want to relate the energy use of their machines to the quantity produced. It suits a comparison of two machines with similar products, a measuring week before an investment or the preparation of an energy audit.
How to work with the energy KPI template
- 1
Set the boundary
Define machine, meter, included auxiliaries and period before you enter the first meter reading.
- 2
Log the intervals
Enter one interval per row with meter readings, time, operating state and good quantity, without gaps or overlaps.
- 3
Compare the machines
Read kWh per good part and base load on the KPI sheet and compare only machines with similar products.
What counts in energy KPIs per machine
The ratio of the totals is the right value
kWh per good part divides total consumption by all good parts of the period. An average of the single ratios gives short intervals too much weight.
Base load shows consumption without output
In idle mode, hydraulics, cooling and extraction keep running. Base load shows what switching off during breaks and weekends can save.
A meter change breaks the series
When a meter is replaced or reset, the difference gives a wrong consumption. Start a new interval afterwards instead of offsetting the values.
How to
How to calculate energy KPIs per machine
The core energy KPI per machine is specific energy consumption: kWh per good part = total energy in a period ÷ good parts in the same period. Add the base load, the average power in kW while the machine is idle, and a load profile over time. Together they separate the energy that goes into output from the energy used while nothing is produced.
Read the meter at the start and end of each interval. Consumption = end reading minus start reading; average power = consumption ÷ duration in hours. Assign each interval an operating state, such as production, idle or off, and the good quantity produced. Use the same meter boundary for every machine you compare, for example with or without the chiller and the extraction.
Compare like with like. A larger part or a longer cycle raises kWh per part without any loss of efficiency, so compare machines only on similar products or normalize by weight. Energy management standards such as ISO 50001 and ISO 50006 call such ratios energy performance indicators, EnPIs, and compare them with a baseline that accounts for output and other relevant variables.
Example
Example: Energy KPIs for an injection molding machine
One machine over four intervals of 8 hours. All meter values and quantities are example values.
| Interval | State | Hours | kWh | Good parts |
|---|---|---|---|---|
| Mon early | Production | 8 | 96 | 1,200 |
| Mon late | Production | 8 | 100 | 1,150 |
| Mon night | Idle | 8 | 28 | 0 |
| Tue early | Production | 8 | 92 | 1,250 |
| Total | 32 | 316 | 3,600 |
kWh per good part is 316 ÷ 3,600 = 0.088 kWh, or 88 Wh. The idle night uses 28 kWh, a base load of 3.5 kW and 8.9 percent of the total, so switching the machine off or into standby is the first thing to check.
Questions and answers
Common questions about energy KPIs in manufacturing
What are the most common energy KPIs in manufacturing?
Common energy KPIs are specific energy consumption in kWh per part or per ton, energy cost per unit, base load in kW and its share of total consumption, and peak demand in kW. At plant level, many companies also track energy per unit of revenue or value added. Per machine, kWh per good part and base load are the best starting point.
What is the difference between energy consumption and energy performance?
Energy consumption is the absolute amount, for example 316 kWh in a day. Energy performance relates consumption to output or another driver, for example 88 Wh per good part. Consumption can rise while performance improves, for instance when output grows faster than energy use. Only the ratio shows whether the process got better.
Do you need a separate meter for each machine?
For KPIs per machine, yes, or at least a meter per group of machines that you compare as one unit. A main meter shows the whole plant and hides which machine uses what. For a first measuring week, a portable logger on the machine supply is often enough to see the load profile and the base load.
How often should you read the meters?
For kWh per good part per shift or day, one reading at the start and end of each shift is enough. For a load profile that shows idle times and peaks, you need interval values of 15 minutes or shorter, which usually means an electronic meter with data logging instead of manual readings.
Further reading
Download the energy KPI template
Fill in the short form and you receive the download right after.