



TEMPLATE
Scrap rate and PPM: Excel template
Use this template to calculate scrap rate, PPM and DPMO from your own inspection figures.
Download the template
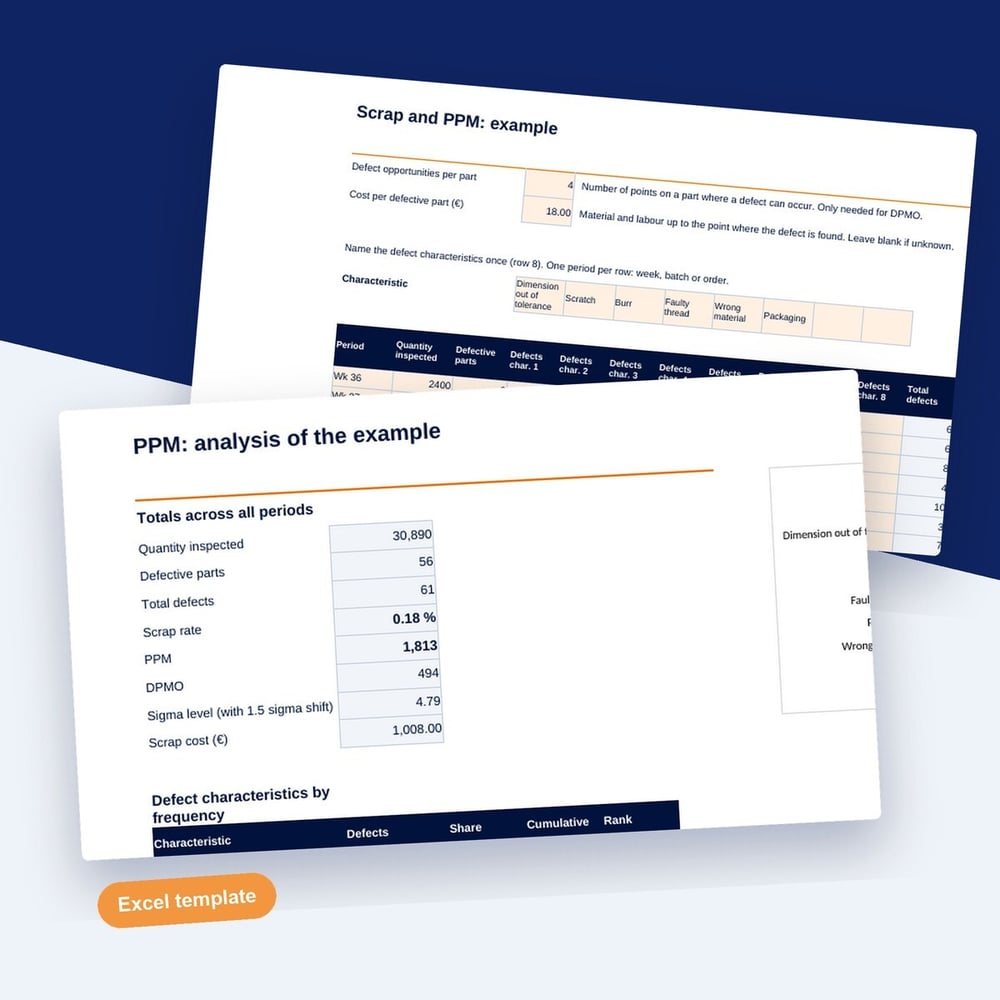
What is in the template
For each week or batch, you enter the quantity inspected, the defective parts and the defects per characteristic. The analysis ranks the characteristics by frequency and shows the PPM trend.
- Data entry per week or batch with quantity inspected, defective parts and defects per characteristic
- Scrap rate, PPM, DPMO and scrap cost by formula
- Characteristics ranked by number of defects, with share and Pareto chart
- PPM trend across the periods, plus a filled-in example
If you no longer want to collect scrap figures by hand: SYMESTIC, the cloud-native MES, records scrap by reason, manually or automatically from the machine signal, and shows the top defect reasons, the defect rate in percent or PPM and the trend. In a free 30-minute live demo, we show you SYMESTIC on your own use case.
Who it is for
Who the scrap rate and PPM template is for
The template is for quality engineers and production managers who report scrap in PPM and want to see which defect characteristic to tackle first. It suits a weekly or batch based review of one product family with your own inspection figures.
How to work with the scrap rate and PPM template
- 1
Set the basis
Enter the defect opportunities per part and the cost per defective part, and name up to eight characteristics.
- 2
Enter each period
Enter quantity inspected, defective parts and defects per characteristic for each week or batch.
- 3
Read the ranking
Check which characteristics cause most defects and follow the PPM trend across the periods.
What to watch with scrap rate and PPM
Defective parts and defects are two counts
One part can carry several defects. PPM counts defective parts, DPMO counts defects per opportunity, and mixing the two makes the figures inconsistent.
The opportunities set the DPMO
DPMO depends on how many defect opportunities you count per part. Keep this number fixed, or values from different periods cannot be compared.
Cost makes the ranking concrete
The most frequent characteristic is not always the most expensive one. Valuing defective parts with their cost shows where an action pays off first.
How to
How to calculate scrap rate, PPM and DPMO
Scrap rate = defective parts ÷ quantity inspected × 100, in percent. PPM uses the same ratio on a scale of one million: PPM = defective parts ÷ quantity inspected × 1,000,000. DPMO counts defects instead of parts: DPMO = defects ÷ (quantity inspected × opportunities per part) × 1,000,000. A scrap rate of 0.1% equals 1,000 PPM.
Decide what counts as defective before you collect data. Scrapped parts, reworked parts and parts rejected by the customer are three different counts. A plant that reports only scrap and leaves rework out shows a lower PPM than a plant that counts every part that was not right the first time. Write the definition next to the figure, together with the inspection point where parts are counted.
Customer PPM and internal PPM answer different questions. Customer PPM relates the parts the customer rejects to the parts delivered and shows what reaches the customer. Internal PPM relates the defective parts found in your own inspection to the parts inspected and shows how well the process runs. Report both, because a low customer PPM can rest on a lot of sorting inside the plant.
Example
Example: one week on a turned part
Final inspection checks 48,000 turned parts in one week, with 4 defect opportunities per part. Sample values:
| Figure | Calculation | Result |
|---|---|---|
| Defective parts | counted | 96 |
| Defects | counted | 120 |
| Scrap rate | 96 ÷ 48,000 × 100 | 0.20% |
| PPM | 96 ÷ 48,000 × 1,000,000 | 2,000 |
| DPMO | 120 ÷ (48,000 × 4) × 1,000,000 | 625 |
PPM is 3.2 times the DPMO here, because each defective part carries 1.25 defects on average and every part has four opportunities. Compare only figures of the same type from period to period.
Questions and answers
Common questions about scrap rate and PPM
How do you convert a percentage into PPM?
Multiply the percentage by 10,000. A scrap rate of 0.5% equals 5,000 PPM, and 0.01% equals 100 PPM. The other way round, divide PPM by 10,000: 250 PPM equal 0.025%. PPM is used for small rates because whole numbers are easier to compare than percentages with many decimal places.
What is a good PPM value?
There is no general target. Customers set PPM targets in their quality agreements, and these differ by industry, part and customer. Take the external target from your customer agreement. Internally, set targets for the characteristics that cause most defects and track whether their trend goes down.
What is the difference between scrap rate and first pass yield?
First pass yield is the share of parts that are good at the first attempt: first pass yield = parts good without rework ÷ parts started. A process with 2% scrap and 5% rework has a final yield of 98% but a first pass yield of 93%. Scrap rate alone hides the rework.
How do you calculate scrap cost?
Multiply the defective parts by the cost per part at the point where they were scrapped. A part scrapped after the last operation carries its material and every processing step, a part scrapped after the first operation much less. One average value per part makes early and late scrap look the same.
How many parts do you need for a reliable PPM value?
Enough that one defect more or less does not swing the figure. With 5,000 inspected parts a week, a single defective part moves the weekly value from 0 to 200 PPM. For low rates, report a rolling value over several weeks next to the weekly one.
Further reading
Download the scrap rate and PPM template
Fill in the short form and you receive the download right after.