Use this downtime cost calculator to find out what unplanned downtime really costs your production – per event, per period, and annualized for the full year.
Choose what your downtime duration refers to – this determines the annual projection.
1
Downtime
Duration of the downtime and the share of capacity affected.
Downtime duration
h
!
Per event or per selected period
Share of capacity affected
%
!
100 % = complete shutdown
2
Production & Margin
Throughput and contribution margin – the basis for lost profit.
Production rate
pcs/h
!
Throughput under normal operation
Contribution margin per unit
EUR
!
Profit per unit – NOT the selling price
=Lost units600pcs
=Lost contribution margin1.200 €
3
Continuing costs (optional)
Costs that still accrue during the downtime.
Idle staff (count)
!
Paid, unproductive employees
Labor cost per hour
EUR/h
!
Per employee, incl. payroll overhead
Overhead per hour
EUR/h
!
Fixed plant/machine costs that keep running
One-off costs per event
EUR
!
Repairs, rush surcharges, scrap, penalties
4
Projection & Currency
Annual projection and display currency.
Events per year
!
For the annual projection
Currency
per Week pcs
Largest cost block
Cost per hour
Downtime duration
5h
Annualized projection
Incl. hidden costs¹
¹ Studies (Aberdeen) show that direct losses often underestimate total costs by 40–60 %. Context note – not included in the figure.
∑
Annual projection
Enter the number of events per year on the left to see your annual downtime costs.
Cost breakdown
How the downtime costs break down per Week.
Total per period
Lost contribution margin
Labor cost (idle)
Overhead
One-off costs
!Please enter the contribution margin per unit – not the selling price. Using revenue would significantly overstate the costs.
Recommendations
Get your results as a PDF
Your inputs, results and rating on one page, plus a print view and a link to your results. Free.
Enter your values and your report will be ready.
Please enter the downtime duration, production rate, and contribution margin per unit to see your downtime costs.
A free tool from SYMESTIC – Manufacturing Execution System from the cloud.
GUIDE
How to calculate your downtime costs
Four steps from the key figures of your downtime to reliable costs – per event, per period, and annualized for the full year.
1
Capture the downtime
Enter the downtime duration in hours and define what share of your capacity is affected. 100 % means a complete shutdown; for a partial line, correspondingly less.
2
Production & Margin
Enter the production rate (units per hour under normal operation) and the contribution margin per unit – that is, the profit per unit, not the selling price. Variable costs are not incurred for units that are never produced.
3
Continuing costs
Optional: costs that still accrue despite the downtime – paid, unproductive staff, fixed plant/overhead costs per hour, and one-off costs per event such as repairs, rush surcharges, or scrap.
4
Projection & Currency
Choose the reference period (event, week, or month). For “event,” add the number of events per year – from this the calculator extrapolates your annual downtime costs.
Lost contribution margin = Production rate × affected capacity × contribution margin per unit × duration
Labor cost = Number of idle employees × hourly rate × duration
Overhead = Overhead cost per hour × duration
Annual value = Period value × 52 (week) or × 12 (month) or × events per year
Reading the result
The donut shows the largest cost block, the breakdown shows the composition per period, and the projection shows the full annual impact. You can share the result link or export it as a PDF – your inputs stay saved in the link.
WORKED EXAMPLE
Downtime cost calculation: example for a machine breakdown
A hydraulic press on a stamping line breaks down for 3.5 hours. The line normally makes 180 parts per hour at a contribution margin of €6.50 per part. Four operators stand idle, and the repair needs a spare part shipped by express. All figures are illustrative.
Inputs
Reference period
Event
Downtime duration
3.5 h
Share of capacity affected
100 %
Production rate
180 pcs/h
Contribution margin per unit
€6.50
Idle staff and labor cost
4 people at €42/h
Overhead per hour
€85/h
One-off costs (spare part, express freight, service call)
Cost per event€4,095 + €588 + €297.50 + €2,400€7,381
Per downtime hour and per year€7,380.50 ÷ 3.5 h · €7,380.50 × 9 events€2,109 per hour, €66,425 per year
Result: The calculator shows €7,381 per event, €2,109 per downtime hour and €66,425 per year.
What drives the cost
The lost contribution margin is the largest block. The one-off costs follow at a third of the total, so leaving them out understates every event. Per downtime hour the breakdown costs €2,109. Compare that figure with the price of a spare part kept in stock or a faster service contract. If only one of two parallel lines stops, set the capacity affected to 50 %: the event then costs €5,333.
Cost type
Per event
Share
Lost contribution margin
€4,095
55 %
Labor cost (idle)
€588
8 %
Overhead
€298
4 %
One-off costs
€2,400
33 %
Total
€7,381
100 %
Common mistakes
Counting staff as idle who were moved to other work during the stop. Enter only the people who actually waited.
Choosing Week as the reference period for a single breakdown. The calculator then multiplies by 52 instead of the real number of events.
Using the line's nameplate speed as the production rate. Enter the rate the line really runs at, or the lost margin comes out too high.
FAQ
Frequently asked questions about downtime costs
Answers to the most important questions about calculating and reducing downtime costs in production.
Downtime costs are all the costs that arise from an interruption of production. They consist of the lost profit – that is, the contribution margin of good units that are not produced and sold – and the costs that keep running during the downtime, such as paid staff, fixed plant costs, and one-off costs like repairs or rush surcharges.
Downtime costs are made up of four building blocks: the lost contribution margin (production rate × affected capacity × contribution margin per unit × duration), the labor cost for unproductive staff, the continuing overhead costs, and one-off event costs. The sum is the cost per downtime event; multiplied by the frequency (52 weeks, 12 months, or events per year) you get the annual value.
During downtime you do not lose the entire selling price, only the profit share per unit. Material, energy, and other variable costs are not incurred at all for units that are never produced. Calculating with revenue or the selling price would significantly overstate the downtime costs. The decisive figure is therefore the contribution margin – revenue minus variable costs.
This depends heavily on the industry, the equipment, and capacity utilization, and ranges from a few hundred to several thousand euros per hour. In highly automated areas such as automotive manufacturing, the costs are considerably higher. That is precisely why an individual calculation with your own metrics pays off, rather than relying on generic benchmarks.
Planned downtime – such as changeovers, maintenance, or breaks – is scheduled and can be cushioned organizationally. Unplanned downtime caused by faults, defects, or missing material hits production unprepared and is usually the most expensive, because staff and equipment keep running unused.
In addition to the direct losses, follow-on costs arise that are often overlooked: scrap and rework during restart, overtime to catch up, contractual penalties for missed delivery dates, as well as quality and reputational damage. Studies (including the Aberdeen Group) show that the purely direct losses often underestimate the actual total costs by 40–60 %.
The most effective lever is higher equipment availability: shorter changeover times (SMED), predictive maintenance, and faster fault resolution. The prerequisite is to capture downtime automatically instead of estimating it – with machine and operating data acquisition and reliable reason codes you can identify which causes really cost money and take targeted action.
Availability is, alongside performance and quality, one of the three components of Overall Equipment Effectiveness (OEE). Every downtime lowers availability and therefore OEE. Systematic OEE tracking makes downtime and its costs visible, comparable, and prioritizable.
The print view is available after the free unlock at:https://www.symestic.com/en-us/tools/downtime-cost-calculator
Download · Excel
Downtime Log Template
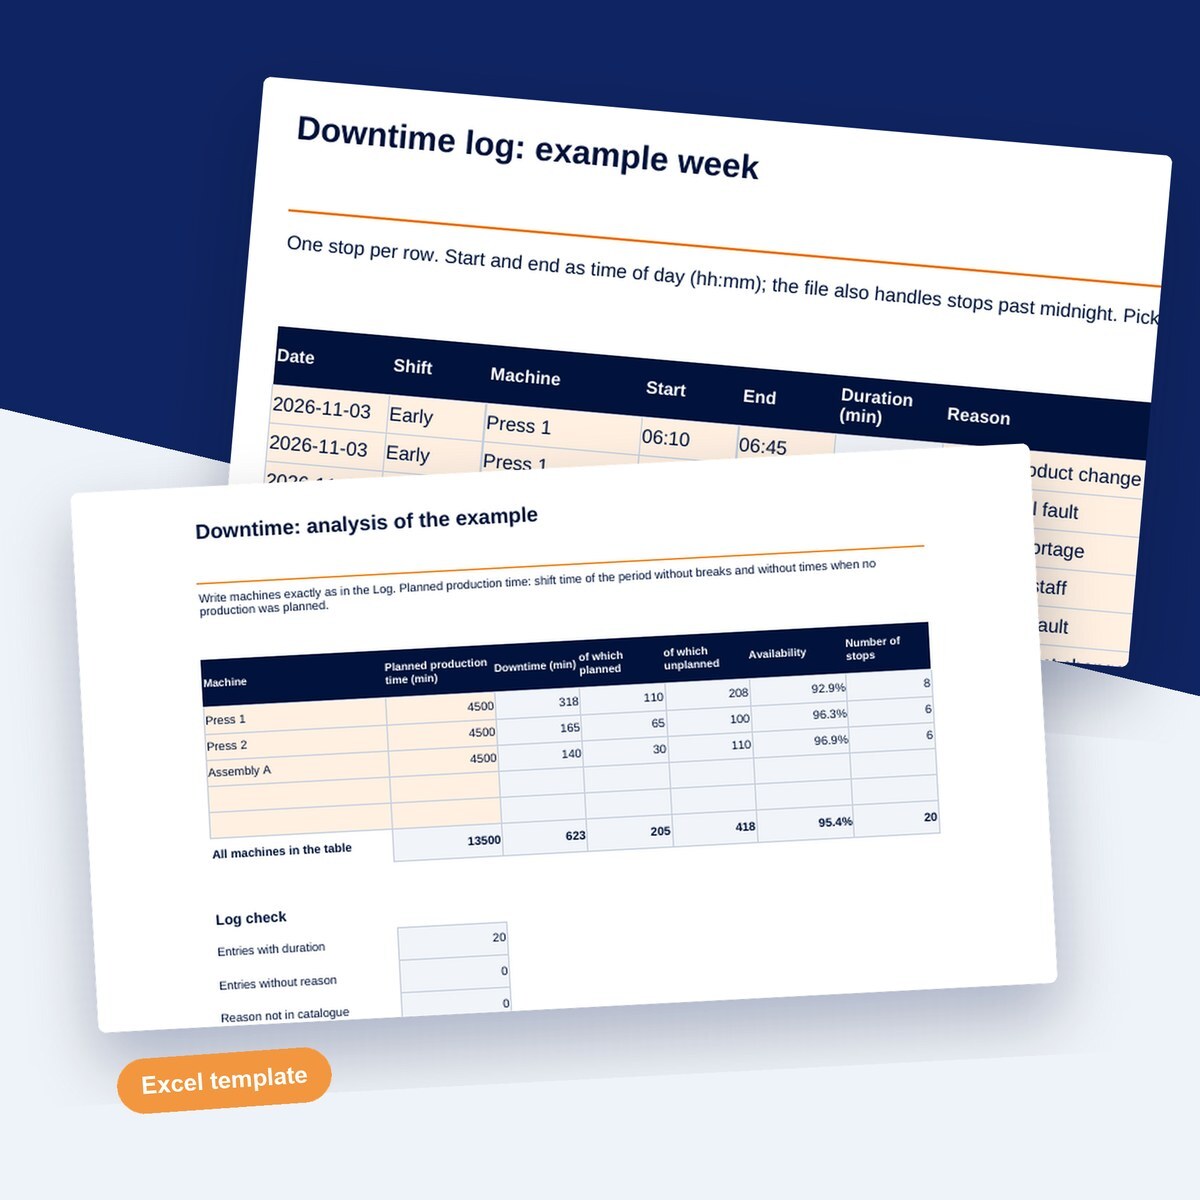
Use this template to log every stop per shift and see which reasons cost the most time.
What is inside
Log per shift with start, end, machine and reason; Excel calculates the duration
Catalogue of downtime reasons, split into planned and unplanned
Availability per machine from planned production time and downtime