



TEMPLATE
Control chart template for Excel
Enter measurements and track mean and range against calculated control limits.
Download the template
What is in the template
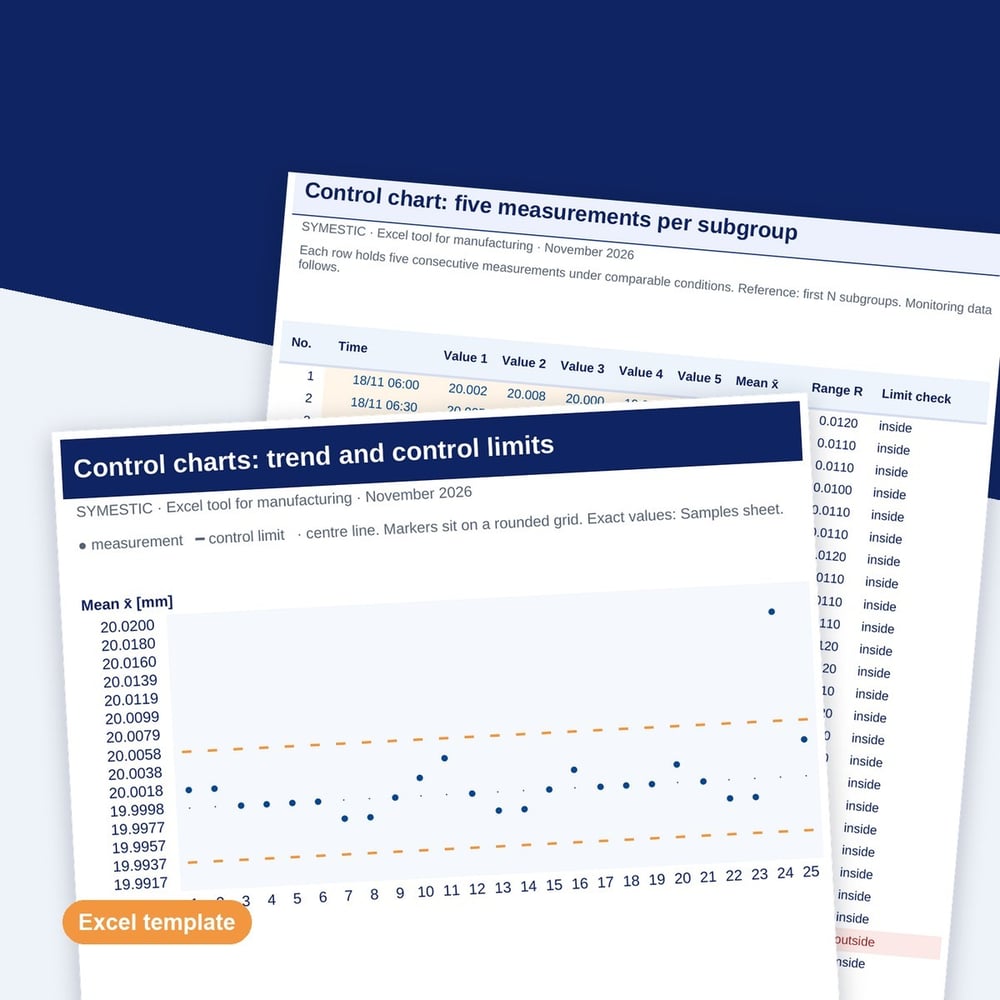
The control chart is a stand-alone Excel tool. It flags single points outside the control limits. You assess specification limits and further run rules separately.
- X-bar R chart for subgroups of five measurements
- Control limits calculated from a defined reference period
- Chart view and flags for points outside the limits
Who it is for
Who the control chart template is for
The template is for quality engineers, process engineers and inspectors who monitor one characteristic such as a diameter or a weight with subgroups of five measurements. It suits a first step into statistical process control on one process before you set up control charts for more characteristics.
How to work with the control chart template
- 1
Define the characteristic
Set one characteristic, one unit and one measuring method per file.
- 2
Set the reference
Choose how many of the first subgroups form the control limits and check for unusual points before you accept the limits.
- 3
Watch the trend
Enter further subgroups and react to every point the file marks outside the limits.
What to know about the X bar R chart
Control limits describe the process
Tolerance limits come from the drawing. Control limits are calculated from your own measurements and show how much the process varies on its own.
The range chart comes first
When the variation within subgroups is unstable, the limits of the mean chart cannot be trusted. Check the R chart first.
The reference must be stable
Limits from a disturbed period are too wide and let real shifts pass. Leave subgroups with a known cause out of the reference.
How to
How to build an X bar R control chart
An X bar R chart tracks the mean and the range of small subgroups, usually five parts measured in a row. You calculate the mean and range of each subgroup, average them over a reference period and set control limits from those averages. Every new subgroup is then plotted against the limits, and a point outside them calls for a reaction.
The formulas for subgroups of five: center line of the mean chart = X double bar, the average of all subgroup means. Upper control limit = X double bar + A2 × R bar, lower control limit = X double bar minus A2 × R bar, where R bar is the average range. For the range chart, the upper limit is D4 × R bar and the lower limit is D3 × R bar, which is zero for n = 5.
Take the parts of one subgroup close together in time, so the range only shows short term variation. Spread the subgroups over shifts, operators and material lots, so the limits cover the normal differences between them. Two errors make a chart useless: drawing the tolerance limits instead of the control limits, and recalculating the limits after every few points so that a slow drift never shows.
Example
Example: shaft diameter with subgroups of five
The reference period of 25 subgroups gives X double bar = 20.012 mm and R bar = 0.020 mm (sample values). That sets the mean chart limits at 20.000 mm and 20.024 mm and the upper range limit at 0.042 mm.
| Subgroup | Mean (mm) | Range (mm) | Signal |
|---|---|---|---|
| 26 | 20.010 | 0.018 | none |
| 27 | 20.015 | 0.022 | none |
| 28 | 20.021 | 0.019 | none |
| 29 | 20.026 | 0.024 | mean above UCL |
| 30 | 20.013 | 0.046 | range above UCL |
Subgroup 29 shows a shift of the mean, for example from tool wear or a new material lot. Subgroup 30 shows more variation within the subgroup, which points to a different cause such as a loose fixture. Both parts can still be within tolerance.
Questions and answers
Common questions about control charts
How many subgroups do you need to set control limits?
A common rule is 20 to 25 subgroups, which with five parts each gives 100 to 125 measurements. Fewer subgroups give limits that move noticeably when you add data. If you have to start earlier, mark the limits as preliminary and recalculate them once the reference is complete.
What rules show that a process is out of control?
The basic rule is one point outside the control limits. The Western Electric rules add patterns inside the limits, for example eight consecutive points on one side of the center line, or two of three consecutive points more than two standard deviations from it. Agree in advance which rules your team applies.
When should you use an X bar S chart instead of X bar R?
Use the X bar S chart when subgroups are larger than about ten parts. The range only uses the largest and smallest value, which wastes information in large subgroups. The standard deviation uses every value. For subgroups of four or five, both charts give practically the same picture.
When should control limits be recalculated?
Recalculate them after a documented change to the process, such as a new tool, machine or material, and after the change has run stable for a new reference period. Do not recalculate them because points fall outside, because that hides exactly the change the chart is meant to show.
How does a control chart relate to Cpk?
The control chart shows whether the process is stable. Cpk compares the spread of a stable process with the tolerance. Calculate Cpk only after the chart shows no signals in the reference period, because a capability index from an unstable process does not predict the next lot.
Further reading
Download the control chart template
Fill in the short form and you receive the download right after.