A corrective action is an action to eliminate the cause of a nonconformity and to prevent it from happening again. This is the definition of ISO 9000:2015, as reproduced in the ERA terminology collection. A correction only removes the nonconformity itself, for example by sorting or reworking parts. A preventive action removes the cause of a potential nonconformity before it occurs. Together they are called CAPA, corrective and preventive action.
This page covers the meaning in quality management. In human resources and in environmental law, "corrective action" has different meanings.
Correction, corrective action and preventive action
ISO 9000:2015 defines a correction as an "action to eliminate a detected nonconformity". The MDSAP procedure published by the FDA quotes this definition next to the one for corrective action. A note in the ISO definition adds that there can be more than one cause for a nonconformity. The table uses one defect, burrs on stamped parts, to show the difference. The example is invented.
| Correction | Corrective action | Preventive action |
|---|
| Targets | The nonconformity that was found | The cause of a nonconformity that occurred | The cause of a nonconformity that has not occurred yet |
| Question | What do we do with the bad parts? | Why did it happen, and how do we stop it from happening again? | Where else could the same cause produce the same defect? |
| Example: burrs on stamped parts | Sort the batch, rework or scrap the parts with burrs | The punch was worn. Replace it and change it at a fixed stroke count from now on | Apply the same stroke-count limit to the other presses that use the same tool type |
| Done when | The bad parts are out of the flow | The defect does not come back over a defined period | The risk is removed on the other presses |
A correction alone is often necessary, because the customer must not receive bad parts. It is not enough. If only the parts are sorted, the worn punch keeps producing burrs, and the same correction is needed again next week.
Corrective action steps, in order
- Describe the nonconformity with data. What defect, on which part, machine and shift, how many, since when. Without this baseline, the effectiveness check in step 5 has nothing to compare against.
- Contain and correct. Stop bad parts from reaching the customer: block, sort, rework. This protects the customer while the cause is still unknown.
- Find the root cause. Use 5 Whys, an Ishikawa diagram or a structured root cause analysis. Check the cause with data: if the cause is right, the defect should appear when the cause is present and not when it is absent.
- Act on the cause. Choose an action that removes or controls the cause, give it an owner and a date. An action like "retrain the operator" only removes the cause if the cause was missing knowledge.
- Verify the effect. Measure the same metric as in step 1, for the same defect and the same scope, over a period long enough to show a change. The FDA procedure above requires that effectiveness is verified and documented.
- Standardize and look sideways. Update the work instruction, the control plan or the FMEA. Then check where else the same cause can occur. This last part is where corrective action turns into preventive action.
How to check that a corrective action worked: a worked example
The check compares the defect rate for the same defect reason before and after the action. The numbers below continue the invented burr example. The defect rate is shown in percent and in PPM (parts per million).
| Period | Parts produced | Parts with burrs | Defect rate | PPM |
|---|
| 4 weeks before the action | 48,000 | 312 | 0.65 % | 6,500 |
| 4 weeks after the action | 46,000 | 23 | 0.05 % | 500 |
The calculation is 312 ÷ 48,000 = 0.0065, which is 0.65 % or 6,500 PPM, and 23 ÷ 46,000 = 0.0005, which is 0.05 % or 500 PPM. Three points decide whether the result can be trusted:
- Same reason, same scope. Count only burrs, on the same press and part. Total scrap can fall for other reasons and hide a failed action.
- A period with the trigger in it. The cause was tool wear. The period after the action must include at least one punch change at the new stroke count, or the test proves nothing.
- Enough events. With only a few defects per week, a drop can be chance. Extend the period until the number of defects before the action is large enough to compare.
If the 23 remaining burrs cluster after one tool change, the cause is only partly removed. The action stays open.
Corrective action, SCAR, 8D and corrective maintenance
| Term | What it is | Relation to corrective action |
|---|
| SCAR (supplier corrective action request) | A formal request to a supplier to find and remove the cause of a defect in delivered parts | The same steps, carried out by the supplier and reviewed by the customer |
| 8D | A problem-solving method with eight steps (disciplines) and a matching report format | One way to run and document a corrective action. See root cause analysis |
| Corrective maintenance | Repair of an asset after it has failed | A maintenance term. A repair is a correction of the asset. A corrective action would remove the cause of the failure |
| CAPA | The quality process that combines corrective and preventive actions, usually tracked in a QMS | The umbrella term |
Why corrective actions fail
- The action targets the symptom. Sorting, extra inspection or a warning sign reduce escapes, but the cause stays. The defect rate at the machine does not change.
- The action is closed on the implementation date. Without a check in the following weeks, nobody knows whether the defect came back.
- The metric changes. Before the action, defects were counted per part. After it, scrap is reported in kilograms or for the whole line. The two numbers cannot be compared.
- The cause was never tested. The first plausible cause from the meeting is taken as fact. If the action does not work, the team has lost weeks.
What SYMESTIC contributes
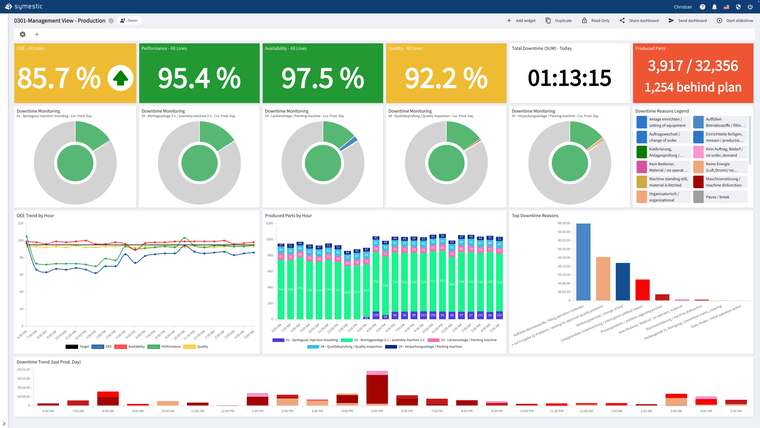
The CAPA workflow itself, with owners, deadlines and approvals, belongs in a QMS or CAQ system, which can be connected to SYMESTIC via the REST API. SYMESTIC supplies the data for steps 1 and 5. Scrap and rework are recorded by reason, entered by hand at the workstation or derived automatically from the machine signal. The top defect reasons and the defect rate in percent or PPM show the baseline and the result of the action. Stop reasons can be analyzed by machine, order and shift. More on quality control software.
Sources
Related: Root cause analysis · SCAR · 5 Whys · PDCA · Cost of poor quality
A free live demo shows how scrap and rework are recorded by reason: book 30 minutes with an expert.