



Contents
A production strategy, also called manufacturing or operations strategy, is the pattern of long-term decisions about how a company makes its products: capacity, plants, process technology, make or buy, and how the factory is planned, staffed and controlled. In the words of a University of Tokyo lecture, it is a pattern of consistent decisions aimed at maintaining and improving competitiveness (Fujimoto).
Wickham Skinner argued in 1969 that manufacturing is seldom neutral. It is either a “competitive weapon or a corporate millstone”, and seemingly routine decisions come to limit a company's strategic options for years (Harvard Business Review).
Order winners and qualifiers
A common starting point is the market. Terry Hill distinguishes order winners, the criteria that win more orders, from qualifiers, the minimum a product must meet to be considered at all (cited in Menda, University of Cape Town). The same factory can face different criteria in different segments. A typical, simplified example:
| Segment | Qualifiers | Order winner | What the factory needs |
|---|---|---|---|
| Automotive series parts (example) | quality targets, certification, delivery reliability | price | low unit cost, high OEE, long runs |
| Spare parts | quality, price within range | delivery speed | stock of finished parts or very short setups |
| Special machinery | price within budget | engineering capability and delivery date | engineer to order, tight project control |
Criteria shift over time. When competitors catch up, short lead time can turn from an order winner into a qualifier, and the factory has to find the next advantage.
Structural and infrastructural decisions
The Tokyo lecture separates structural (hard) and substructural (soft) decisions. Structural decisions need large investments and involve top management. Substructural decisions, often called infrastructural, are the many smaller ones made every day.
| Type | Decision area | Example question |
|---|---|---|
| Structural | capacity | a second line or a third shift? |
| Structural | plant network | one large plant or several near customers? |
| Structural | process technology | robot cell or manual assembly? |
| Structural | vertical integration | heat treatment in-house or outsourced? |
| Infrastructural | planning and control | make to stock or to order, which lot sizes? |
| Infrastructural | quality assurance | inspection at the workstation or in the lab? |
| Infrastructural | workforce and organization | specialists per machine or multi-skilled teams? |
Whether cost, quality, delivery and flexibility always trade off against each other is debated. The static view says that improving one costs another. The dynamic view in the same lecture does not take the trade-off as given, because continuous improvement can raise several at once.
Where the customer order enters
One of the most far-reaching decisions is the order penetration point: the stage from which production follows a customer order. Upstream, production runs to forecast. The ETH Zurich course material distinguishes the main types by where stock is held (ETH Zurich).
| Type | Stock held at | After the order arrives |
|---|---|---|
| Make to stock | finished goods | delivery from the finished goods warehouse |
| Assemble to order | assemblies or components | final assembly of the customer-specific product |
| Make to order | raw material, or none if purchased after the order | production; design and process already exist |
| Engineer to order | none, at least for customer-specific parts | design, then purchasing and production |
Example: choosing the stocking point for a pump series
The numbers are invented for illustration. A pump series takes 15 days for purchasing, 8 days for machining and 2 days for final assembly. Whatever is not in stock must fit into the lead time customers accept. The plant holds 200 units at the chosen stocking point. One unit of raw material is worth 40 dollars, a set of machined parts 90 dollars, a finished pump 130 dollars.
| Lead time customers accept | Time after the order | Stock held as | Type | Capital tied up |
|---|---|---|---|---|
| 25 days or more | 15 + 8 + 2 = 25 days | nothing | make to order | 0 dollars |
| 10 days | 8 + 2 = 10 days | raw material | make to order | 8,000 dollars |
| 5 days | 2 days | machined parts | assemble to order | 18,000 dollars |
| 1 day | 0 days | finished pumps | make to stock | 26,000 dollars |
The shorter the accepted lead time, the further the stock moves toward the finished product and the more capital it ties up. The choice also changes the shop floor. With assemble to order, final assembly runs many small orders and needs short changeovers, while machining can keep running larger lots.
Measuring whether the strategy works
Each priority needs a KPI on the line, defined the same way in every plant and reviewed per shift rather than in the monthly report.
| Priority | KPI on the shop floor |
|---|---|
| Cost | OEE, cost per unit, scrap cost |
| Quality | first pass yield, defect rate in ppm |
| Delivery | schedule adherence, lead time |
| Flexibility | setup time, lot size, variants per line |
What SYMESTIC contributes
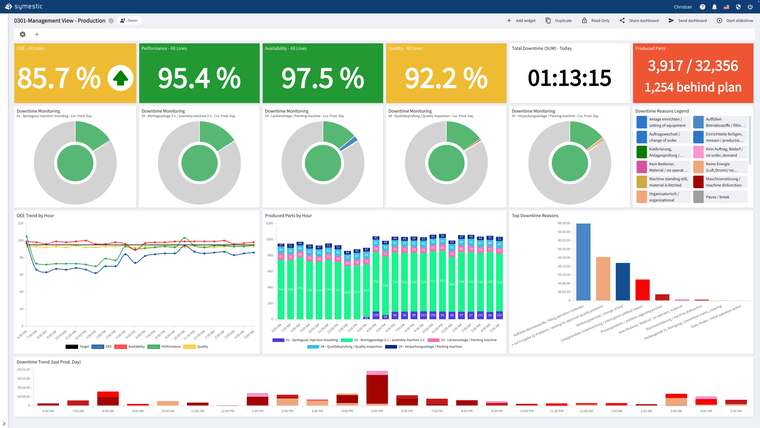
Strategy is set by management, and SYMESTIC measures whether the shop floor delivers it. Quantities, downtime and scrap are captured automatically, OEE is visible live per machine and shift, and the status and current operation of every order can be tracked live. Plants can be compared using the same KPIs. With SYMESTIC, Meleghy achieved 10 % less downtime and 7 % more output, with the rollout covering 4 plants in 6 months.
More on the pages on multi-plant comparison and OEE software.
Sources
- Takahiro Fujimoto, University of Tokyo OCW: Business Administration, Lecture 19: Production Strategy
- Wickham Skinner: Manufacturing, Missing Link in Corporate Strategy, Harvard Business Review, May 1969
- R. Menda: Manufacturing Strategy Formulation, University of Cape Town, 2001 (on Hill's order winners and qualifiers)
- ETH Zurich OPESS: Features in reference to logistics and production resources, section 4.4.3
A free live demo based on your own use case shows how KPIs are measured and compared live per line and plant.
See SYMESTIC on your own use case
In a free live demo, a product expert walks you through the running platform and shows what OEE, downtime and the connection of your machines and ERP look like in practice.
- Live OEE
- Downtime and reasons
- Connecting machines and ERP